3c.1b-E17 Example 3 Detect anomalies in time series data with Code Workspaces
- Complicated demo, but quite interesting.
- Code for model to detect time series anomalies.
- Quiver for display data.
- Requires quite a bit of manual action to process data.
- All details in this Docx: #626_.docx.
(MAIN_E17.png)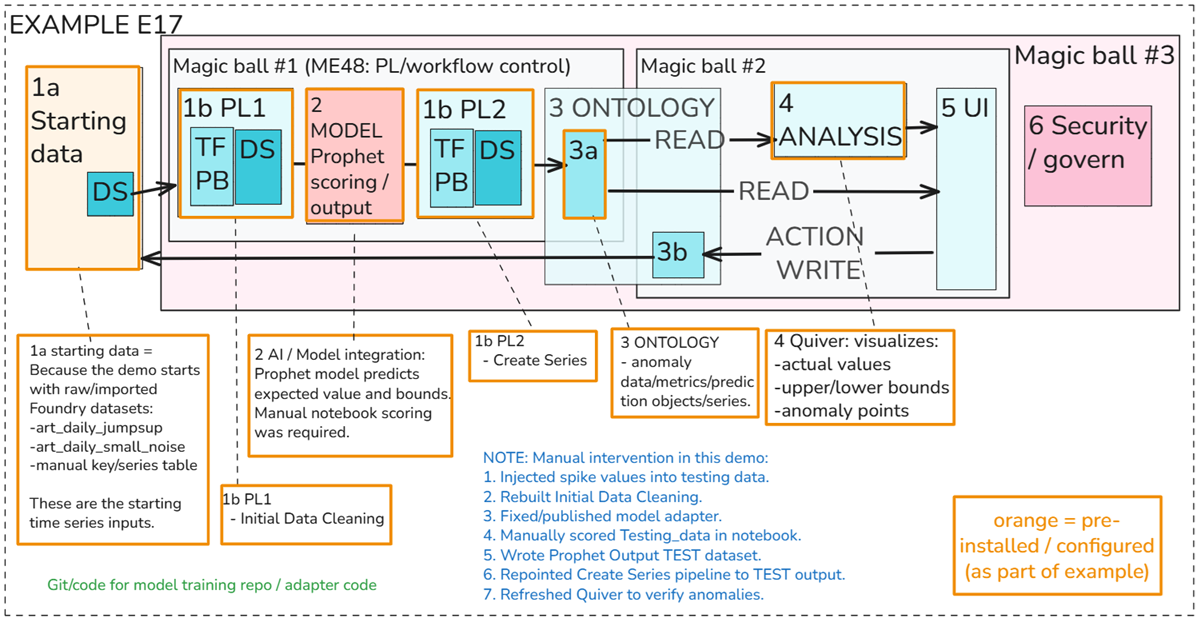
At a high level, the demo uses Foundry pipelines, a Prophet time series model, and Quiver visualization to show anomalous points in a time series. The intended flow is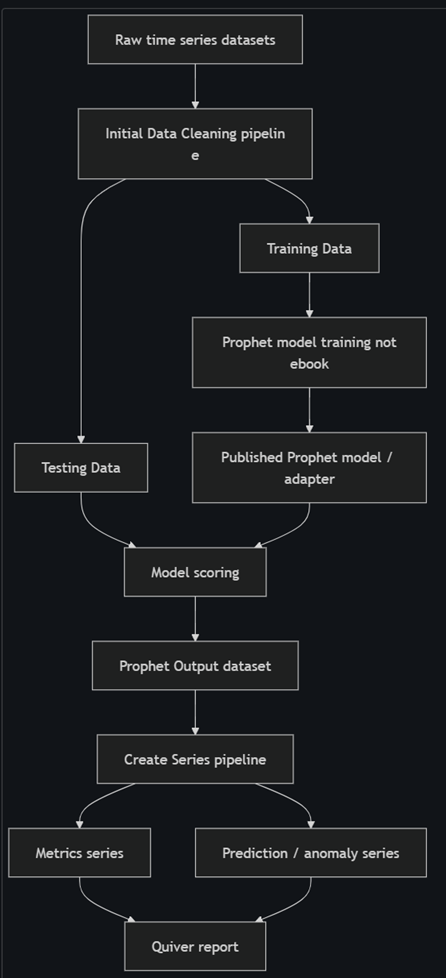
Required modifications to get E17 to process new data (the example was not a start-to-finish process)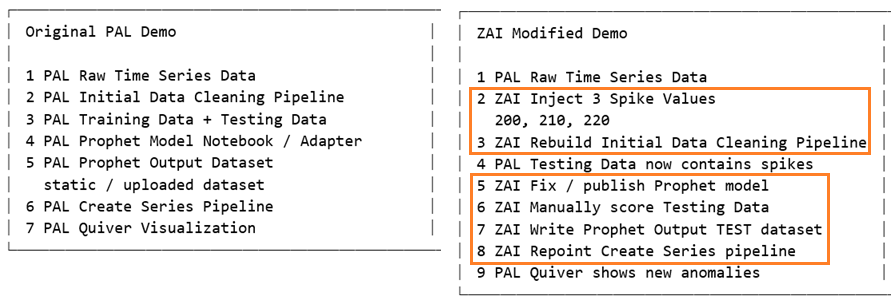
17_05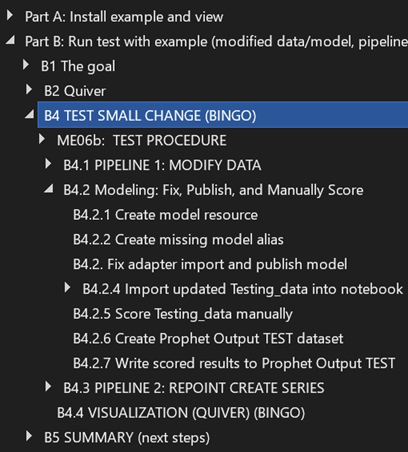
B4.1 PIPELINE 1: MODIFY DATA
17_06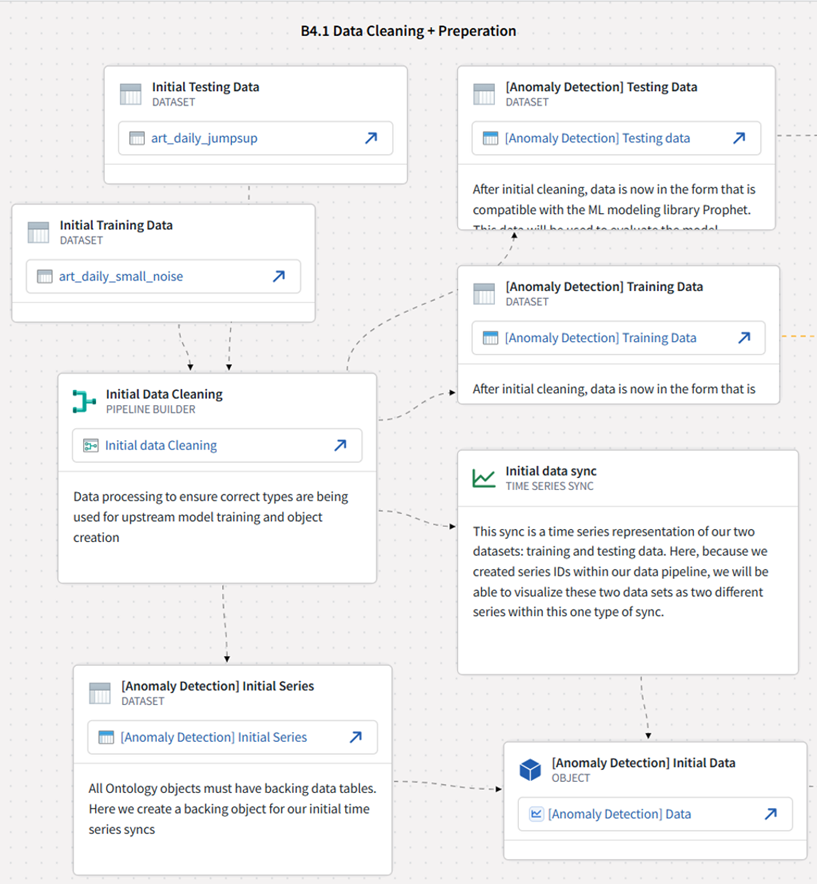
17_07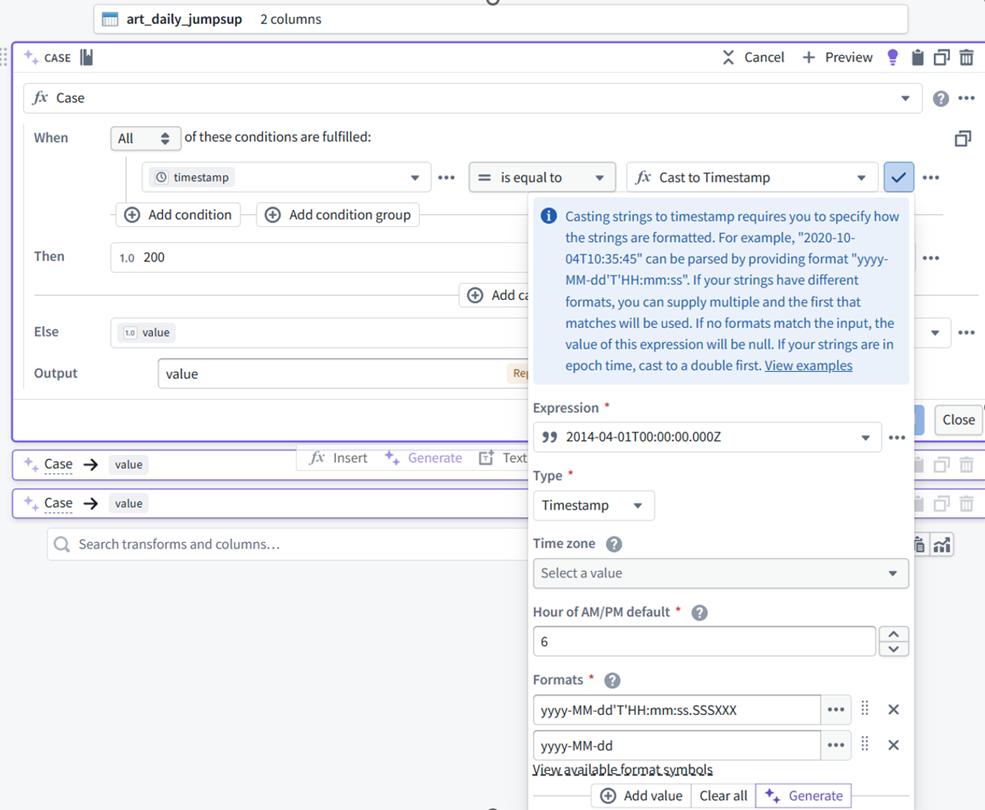
B4.2 Modeling: Fix, Publish, and Manually Score
This is a long section … see docx #626 for details.
17_09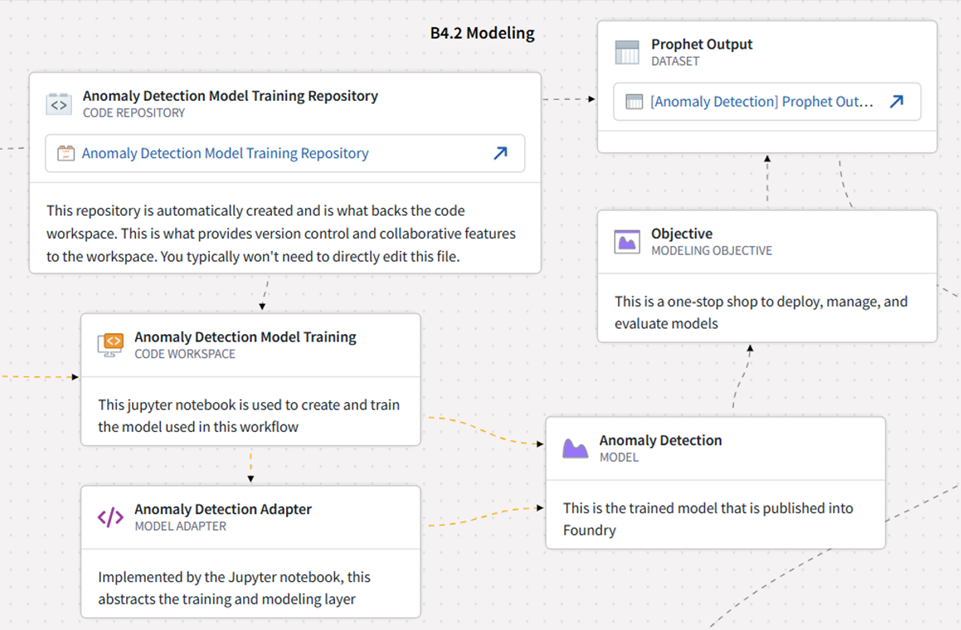
17_08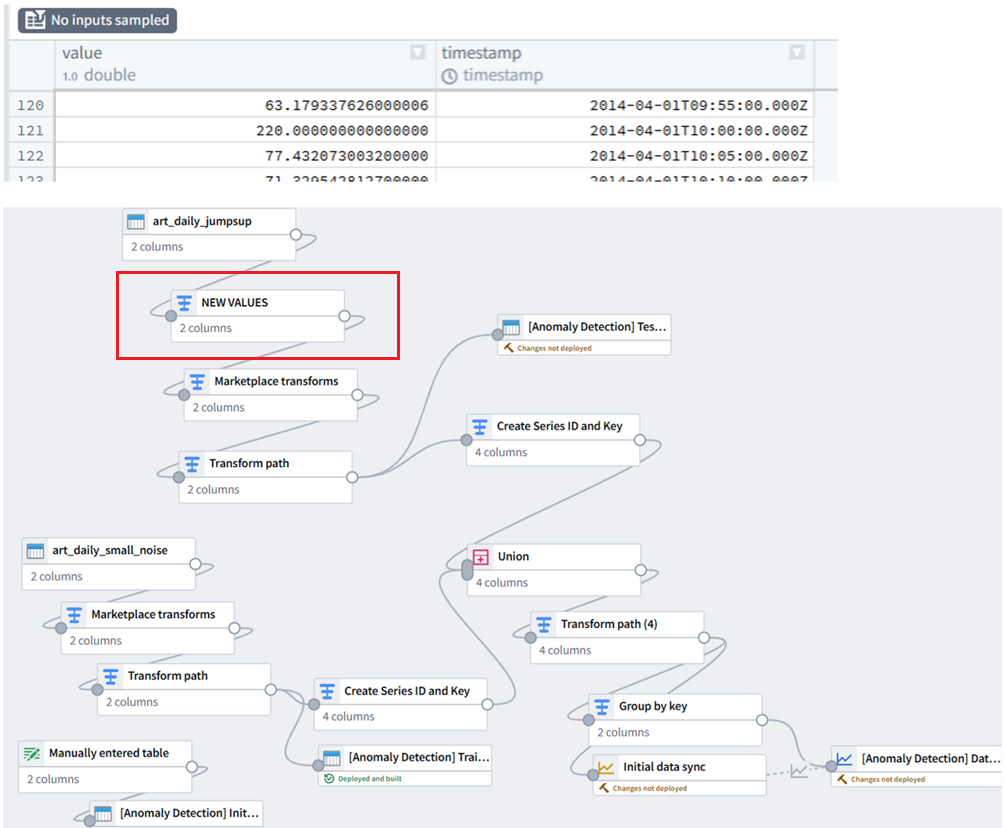
17_10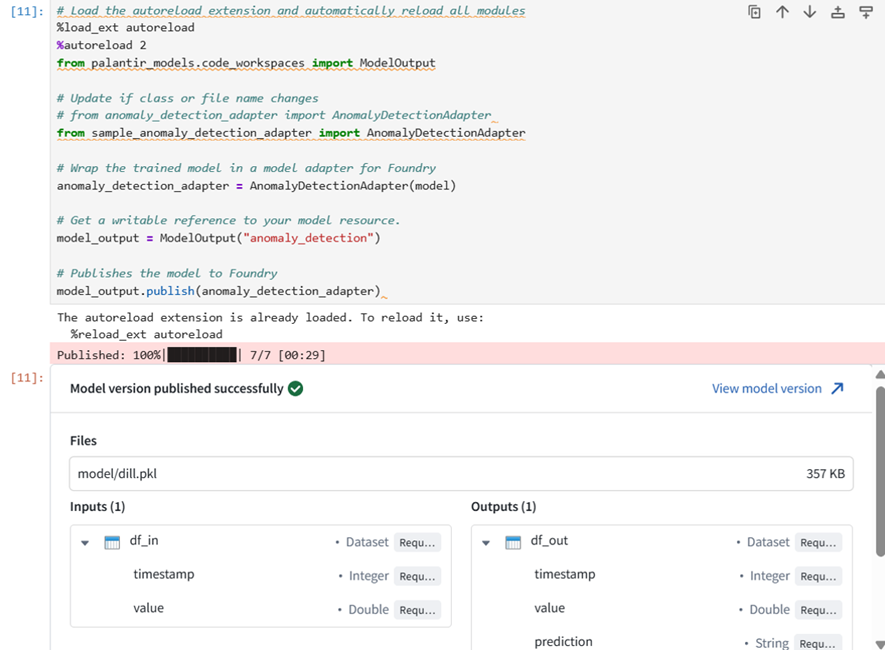
17_11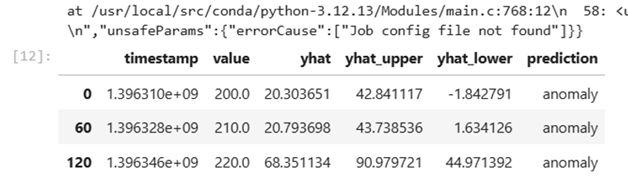
17_12
B4.3 PIPELINE 2: REPOINT CREATE SERIES
17_13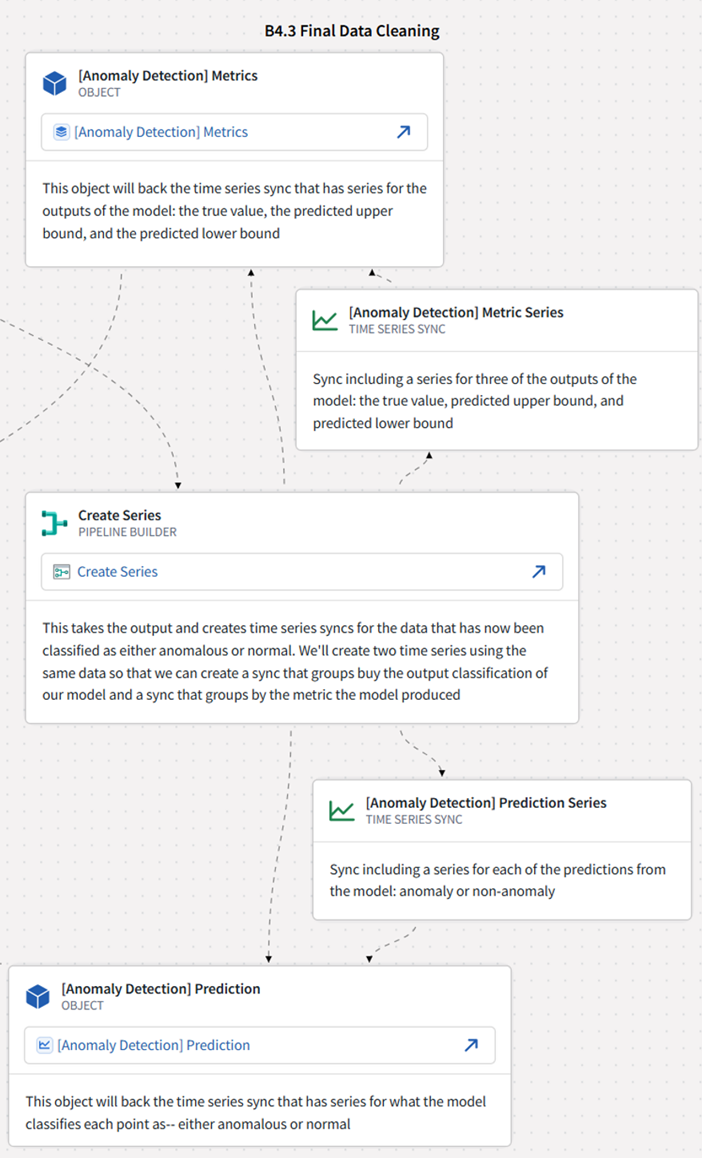
17_14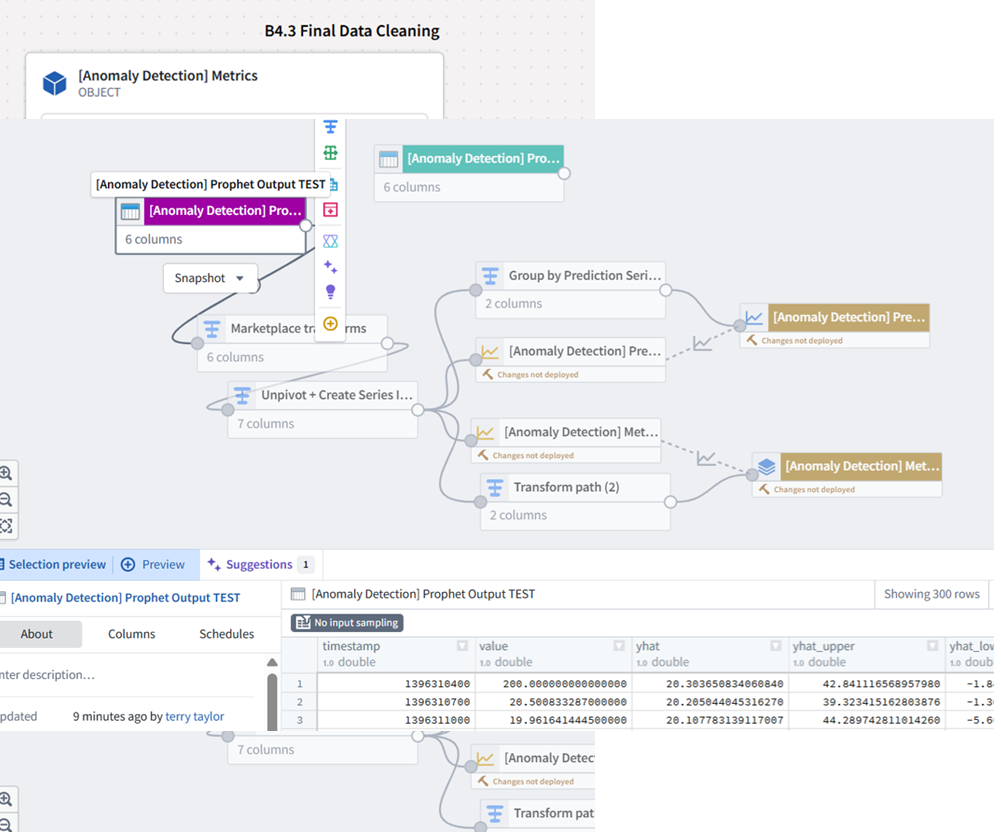
B4.4 VISUALIZATION (QUIVER)
17_15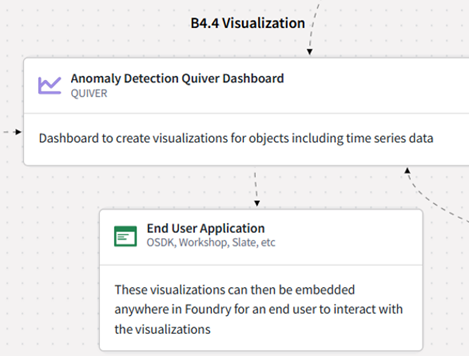
E17 output (the green boxes show my modifications to the input data)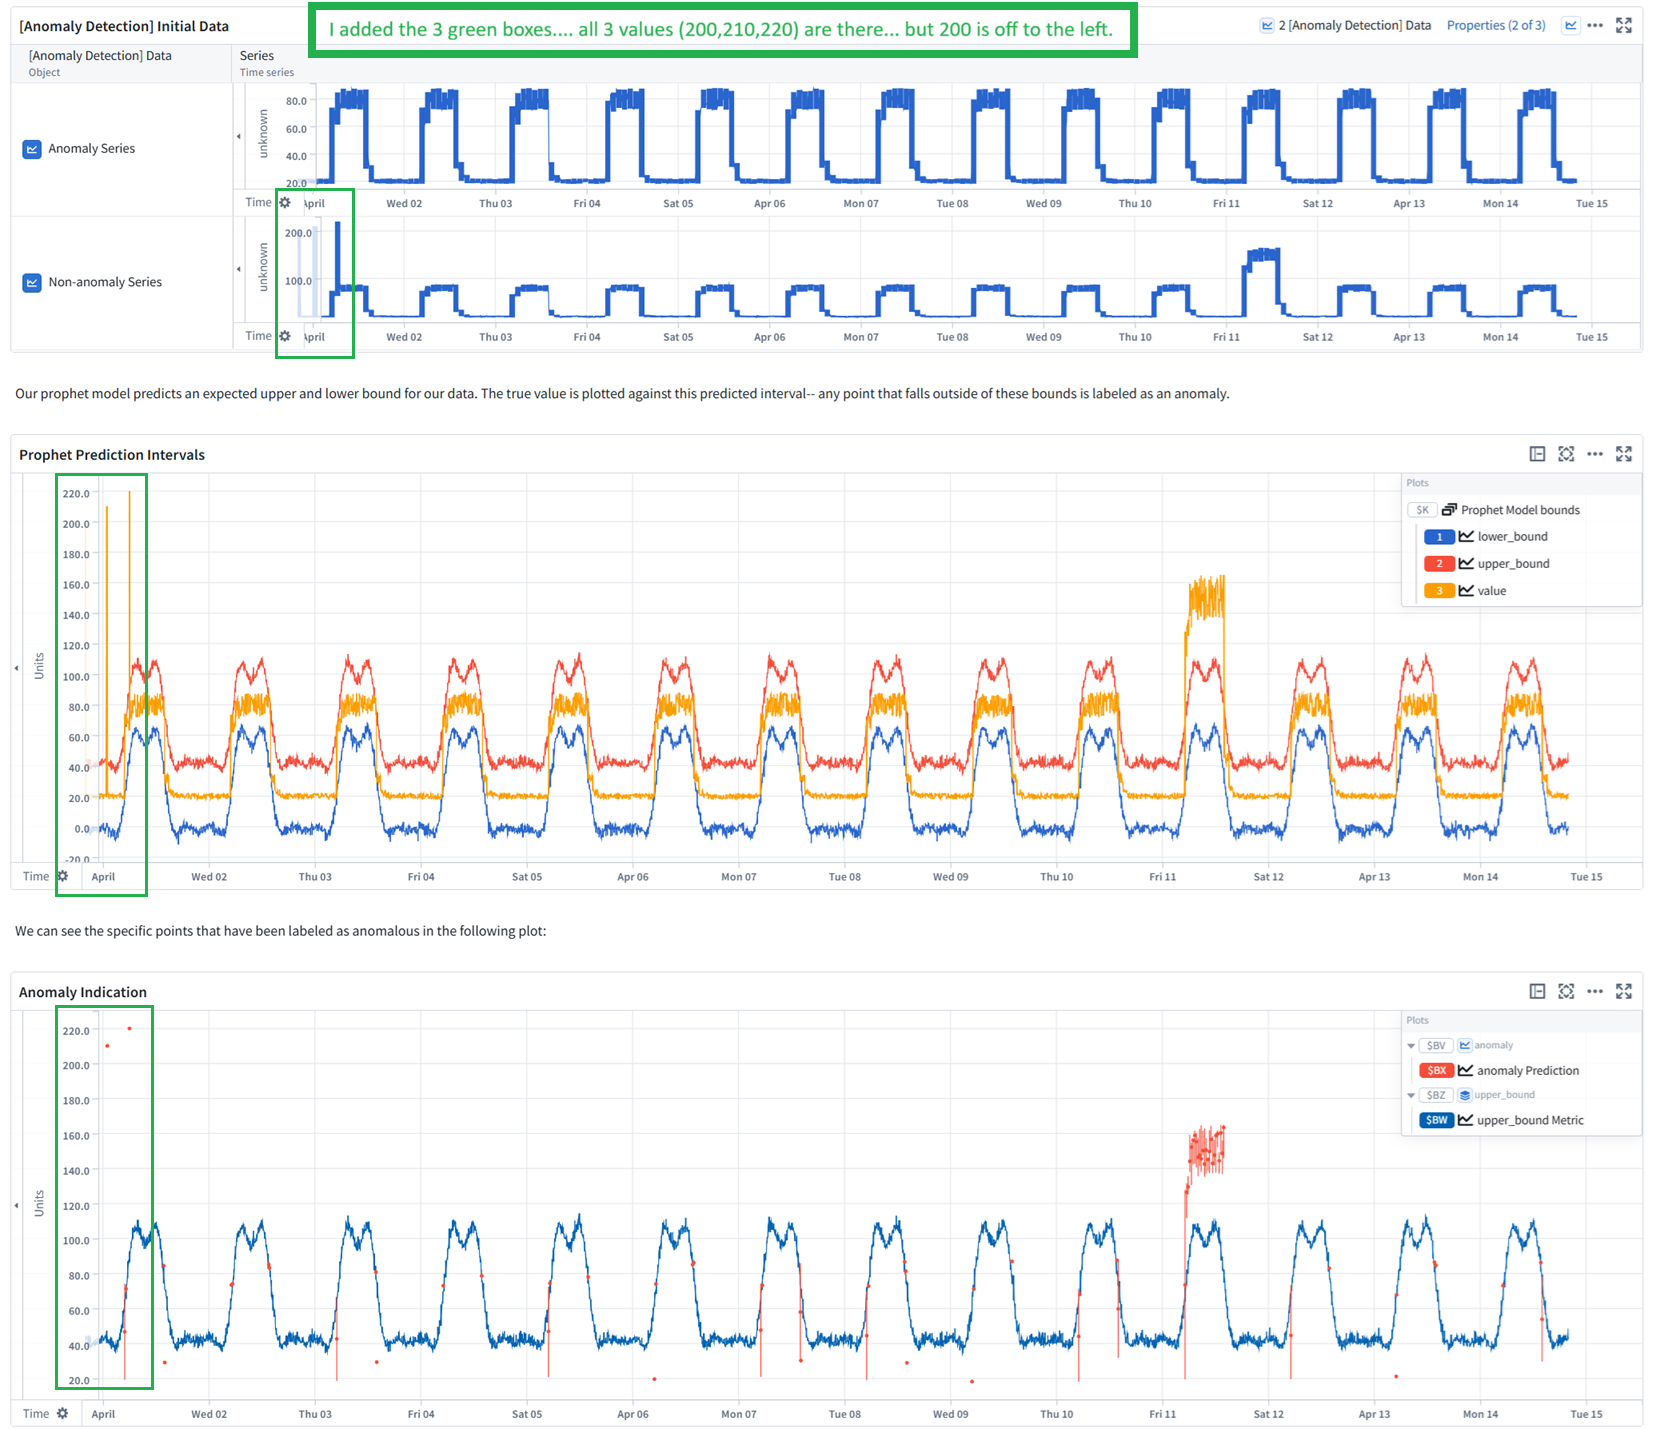
26.0806 (v1 26.0801)