3c.5 PAL biz process mining
PAL-DEMO-5: Speedrun: Mining Your First Business Process (26.0717)
FDE: The demo starts with claims, customers, and claim-history logs. After ingesting these datasets into Foundry, the data is modeled as Ontology objects such as Customers and Claims. Machinery then uses the process logs to reconstruct how claims move through the business process over time. Once the process map is built, you can inspect where claims get stuck, identify why some remain unresolved, and embed the process view into an interactive application.
Mechanically:
- Start with datasets claims, customers, process logs
- Ingest into Foundry upload/import datasets
- Add to Ontology create Customer and Claim object types (link/process logs to claims)
- Mine process logs (Machinery reads event history: claim X moved from state A → state B at time T).
- Build process map (shows actual paths claims took)
- Inspect problems (find unresolved claims, bottlenecks, loops, delays)
- Embed in visual app
See also:
05 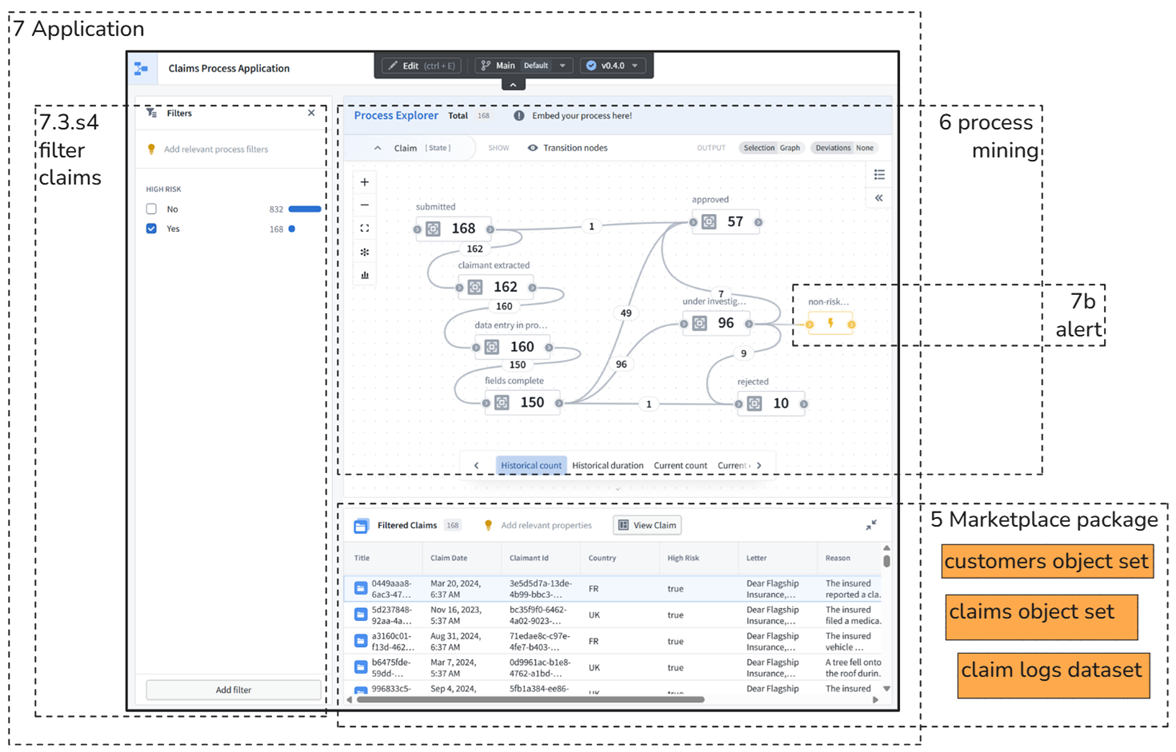
NOTES
Problem:
A company has many claims moving through different states, but the process is hidden inside raw event/log data. It is hard to see:
- where claims get stuck,
- which paths claims actually follow,
- how many claims end approved/rejected/investigation,
- which claims need attention.
How the demo solves it:
The demo turns claim history into a process app:
- Claim logs record state changes over time.
- Ontology models real business objects:
Claim,Customer, and claim state logs. - Machinery mines the logs into a visual process graph.
- Workshop embeds the graph into an app with filters and a claims table.
- Automate can create alerts for claims/process issues.
In one sentence:
It converts messy claim event history into an interactive process-monitoring application.
26.0828 FDE chat
Speedrun: Mining Your First Business Process ++++++++++++++++++++++++++++
- https://learn.palantir.com/speedrun-mining-your-first-business-process
can you sum up what this does ? below is the speedrun intro.. but i am confused. are you searching “needles in a haystack”…. look for certain data in a vast database?
“About Machinery
Real-world processes, such as in business, government operations, or healthcare, all consist of entities that undergo a series of changes over time. Machinery is a powerful process mining and authoring application in the Palantir Foundry platform. It enables you to track, understand, and manage all aspects of these transformative processes. It allows you to identify unwanted behavior and make improvements towards desired outcomes.
Machinery allows you to understand and manage currently existing processes as well as to create new ones. It offers you the ability to visualize and monitor how entities transition between different states. It also offers you integration with other apps in the Palantir Foundry platform so you can view your process in custom applications or automate it through custom logic.
About this course
In this course, we will focus on the process mining capabilities of Machinery, while process authoring will be the topic of a subsequent course. It will consist of an analysis of an existing insurance claims process. Your task will be to identify why several claims are unresolved and what can be done to resolve the situation.
You will start off with a few datasets, which detail the existing claims, the customers who have made them, and the logs that have been generated as the claims move through the stages in your process. You will then ingest these datasets into the Foundry Platform. These datasets will then be added to the Ontology, Foundry’s semantic layer which underpins the rapid development of a host of interactive applications, including Machinery.
With your Ontology Objects ready - i.e. Customers and Claims - you will start mining the process logs into a Machinery process. Once the process has been mapped out, you will then be able to inspect it to investigate what the potential causes of the issue are. You will embed the process into a visual application which you can further customize. This interactive visual application will help you in your task by greatly augmenting the ways in which you can interact with your process.
By the end of this Speedrun, you will have experience in using data about your process - mainly the process entities and their logs - to inspect and interact with it. You will be ready to dive further into our documentation, take some Deep Dive training courses, and start building your own projects.”
FDE:
This is not mainly “needle in a haystack” search.
It is process mining.
What it does
It takes event/log data about a business process and reconstructs the actual workflow.
Example insurance claim:
claim created
→ documents requested
→ adjuster assigned
→ review started
→ approved
→ paid
Or bad path:
claim created
→ documents requested
→ waiting
→ reassigned
→ waiting
→ unresolved
Machinery turns those logs into a process map.
Inputs
claims dataset
customers dataset
claim event logs / process logs
The important one is the log:
claim_id
timestamp
event/state
actor
status
Pipeline / ontology
The datasets are ingested and modeled as ontology objects:
Customer
Claim
Claim events/logs
Then Machinery uses those objects/logs to build the process view.
Output
Machinery shows:
which states claims pass through
how often each path occurs
where claims get stuck
which transitions are unusual
which claims remain unresolved
Is it finding needles?
Kind of, but more specifically:
not searching arbitrary data
but finding bottlenecks, loops, stuck cases, and unusual paths in a process
So the “needle” is:
why are some claims unresolved?
where in the workflow do they get stuck?
what path did they take?
Simple gist
event logs
→ ontology objects
→ process map
→ find bottlenecks / unresolved cases
→ inspect in app
One-line:
Machinery reconstructs a real business process from event logs so you can see how work actually flows, where it gets stuck, and what cases need intervention.
so its these 2 paragraphs ++++++++++++++++++++++++++++++++++++++++++++
"”You will start off with a few datasets, which detail the existing claims, the customers who have made them, and the logs that have been generated as the claims move through the stages in your process. You will then ingest these datasets into the Foundry Platform. These datasets will then be added to the Ontology, Foundry’s semantic layer which underpins the rapid development of a host of interactive applications, including Machinery.
With your Ontology Objects ready - i.e. Customers and Claims - you will start mining the process logs into a Machinery process. Once the process has been mapped out, you will then be able to inspect it to investigate what the potential causes of the issue are. You will embed the process into a visual application which you can further customize. This interactive visual application will help you in your task by greatly augmenting the ways in which you can interact with your process.
FDE
Yes — those two paragraphs are the core.
Mechanically:
1. Start with datasets
   claims, customers, process logs

2. Ingest into Foundry
   upload/import datasets

3. Add to Ontology
   create Customer and Claim object types
   link/process logs to claims

4. Mine process logs
   Machinery reads event history:
   claim X moved from state A → state B at time T

5. Build process map
   shows actual paths claims took

6. Inspect problems
   find unresolved claims, bottlenecks, loops, delays

7. Embed in visual app
   use/customize an app for interacting with the process
Simpler rewrite:
The demo starts with claims, customers, and claim-history logs. After ingesting these datasets into Foundry, the data is modeled as Ontology objects such as Customers and Claims. Machinery then uses the process logs to reconstruct how claims move through the business process over time. Once the process map is built, you can inspect where claims get stuck, identify why some remain unresolved, and embed the process view into an interactive application.
for the data mining demo…. uses machinery… in the bckground is machinery using ai?
FDE
Not necessarily.
For process mining, Machinery can work deterministically from logs:
claim_id
timestamp
state/event
It builds:
process paths
transition counts
durations
bottlenecks
stuck cases
That does not require AI.
It is mostly:
event-log analysis + graph/process visualization
AI could be added later for:
summarizing causes
suggesting interventions
classifying root causes
drafting actions
But the core Machinery process-mining demo is likely not AI unless it explicitly mentions AIP/LLMs/models.
FDE: Yes — this is the right direction.
It’s much better than a pure flowchart because it anchors everything on the final application, which is what the speedrun is really building toward.
My opinion: keep this structure, but refine the labels so it tells the story more clearly.
What works well
- The final Workshop app is in the center. Good.
- The dotted boxes show which chapter created/configured each part.
- It connects:
- Marketplace package,
- process mining,
- Workshop app,
- filters,
- alerting.
- It makes the hidden architecture visible.
What I would improve
1. Rename “object set” to “object type” unless the docs truly mean object set
Your orange boxes say:
customers object set
claims object set
But from what we inspected, these are primarily Ontology object types:
CustomerClaim
So I’d label them:
Customer object type
Claim object type
claim_logs dataset
or:
Marketplace package:
- Customer object type
- Claim object type
- claim_logs dataset
If the tutorial specifically creates object sets later, then use “object set”; otherwise “object type” is more accurate.
2. Add the “Claim State Log” generated object
The process mining part depends on the generated transition log ontology object. I would include it in the chapter 6 box:
6 Process Mining
Machinery graph
Claim + State
[Claim State] Log
7 states / 9 transitions
This explains how the raw claim_logs dataset becomes the graph.
3. Clarify “7 Application”
Instead of just:
7 Application
I’d label it:
7 Workshop Application
Claims Process Application
Because “Application” alone does not tell the tool.
4. Label the center graph as Machinery
Inside the process explorer area, add:
Embedded Machinery process graph
That is the key connection.
5. Add a small UI translation note
Your diagram would be even more useful if it includes a small note:
UI translations:
OMA = Ontology Manager
Application edit mode = Workshop builder
Ready to mine ≠ Save
Confirm + Save persists graph
This captures the real pain points.
Suggested revised labels
Left chapter box
Current:
Docx chapters
5 Uploading the Data
6 Process Mining
7 Building an Application
7b Alerting with automate
Maybe change to:
Speedrun chapters
5 Marketplace / Data setup
6 Process Mining in Machinery
7 Build Workshop Application
7b Alerting with Automate
Orange box
Current:
5 Marketplace package
customers object set
claims object set
claim logs dataset
Suggested:
5 Marketplace package
Customer object type
Claim object type
claim_logs dataset
Optionally add:
starter Workshop app
Process mining box
Current:
6 process mining
Suggested:
6 Process Mining / Machinery
Claim state history → process graph
7 states / 9 transitions
Application box
Current:
7 Application
Suggested:
7 Workshop Application
Claims Process Application
Filter box
Current:
7.3.s4 filter claims
Suggested:
7.3.s4 Filter claims
High Risk = Yes/No
Filters drive graph + table
Alert box
Current:
7b alert
Suggested:
7.5.s1 Automate alert
Trigger from process condition
Overall verdict
Yes — this is exactly the right kind of diagram.
It shows the speedrun as:
Marketplace data/resources
        ↓
Machinery mines process
        ↓
Workshop embeds process graph
        ↓
Filters/table make it operational
        ↓
Automate adds alerting
That is much clearer than the original docs.
Yes — then your diagram should be the first “what are we doing?” diagram.
It should not try to explain every click. It should explain the purpose of the whole speedrun.
Suggested first diagram title
What are we doing in this speedrun?
Core message
We turn claim event history into an operational process-monitoring app.
06 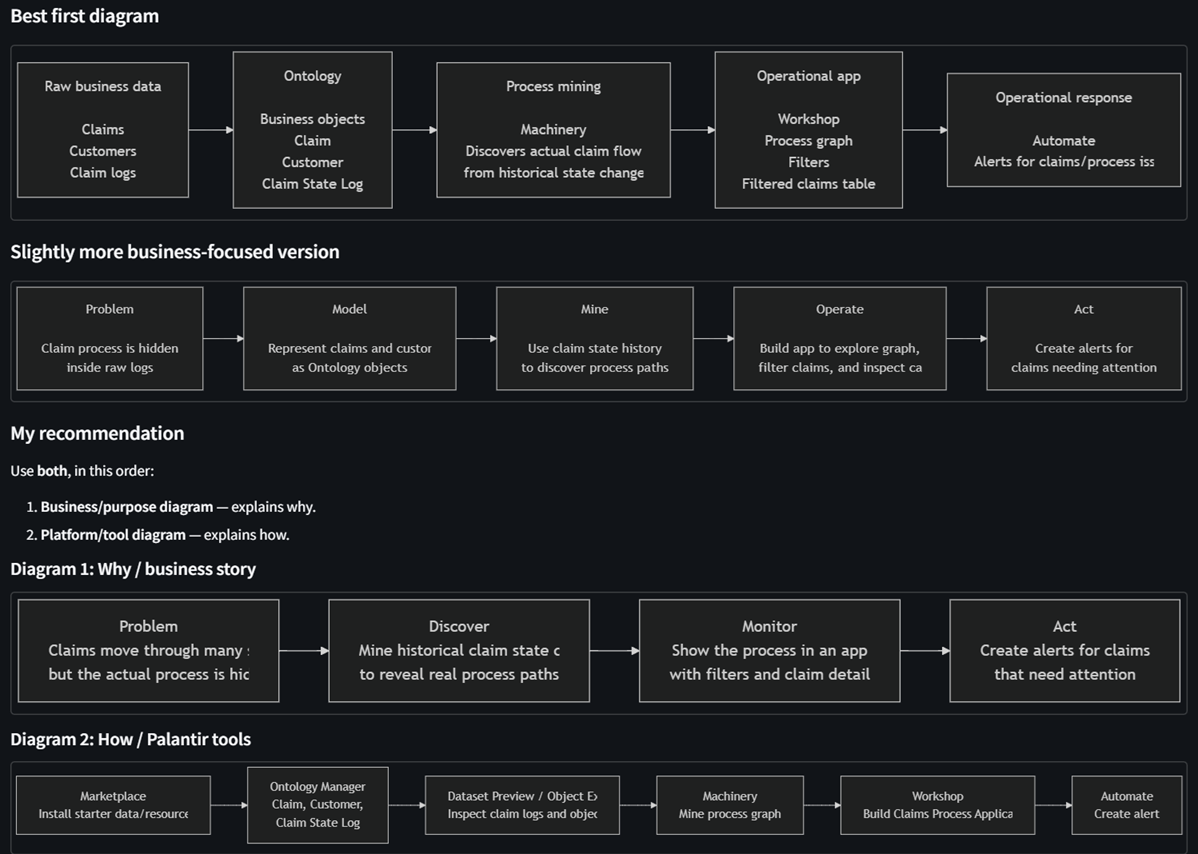
Your screenshot-based diagram should come after these, because it explains where those pieces appear in the final UI.
Suggested document order:
1. What problem are we solving?
2. What are we building?  ← first diagram
3. Which Foundry tools are used?  ← second diagram
4. Final app anatomy  ← your screenshot diagram
5. Detailed chapter-by-chapter flowcharts
That will make your document much easier to understand than the original speedrun.
1 FDE
That makes sense: clicking “Ready to mine” starts a mining/aggregation calculation, but it does not necessarily save the mined result.
I checked the saved Machinery document again, and your file does exist:
:resource[ri.machinery.main.document.79e3414f-3357-4caa-8b29-ca7541c2774d]
I also checked the underlying Ontology data. The data is present:
- Process object type: :resource[ri.ontology.main.object-type.4e9e8375-adf1-4fad-9bec-d94876386718]
- It has 1,000 Claims
- It has 7 states
- The process log object has 4,574 log rows
- There are valid state transitions in the log
So: your source data is not gone.
What is probably happening is:
- You saved
mine_process_1. - That saved the Machinery file / setup.
- You clicked Ready to mine.
- The mining aggregation failed immediately.
- Because the mining result never loaded, there were no mined elements to Confirm.
- When you refresh, Foundry reloads the saved file, but the failed in-browser mining attempt disappears.
So the saved file exists, but the mined process graph was not saved, because the mining step failed before producing elements.
One thing I noticed: the Mine configuration has Actions and automations enabled, but I found no action types on the Claim object. Try this:
- Reopen
mine_process_1. - Go to Mine.
- Turn Actions and automations off.
- Keep States and Transitions on.
- Click Ready to mine again.
If it still errors, click Show error and send me the expanded error text. The short message “Failed to load aggregation result” is too generic, but the expanded error may identify the exact failing aggregation.
2 You’re right — in this screen there is no “Actions and automations” toggle.
I was referring to the later Mining configuration panel from the previous error screen, but if the error appears immediately after Ready to mine, you may not be able to reach that option. So ignore that step.
More importantly, your screenshot shows two different things:
1. mine_process_1 is saved / exists
Your Machinery file exists here:
:resource[ri.machinery.main.document.79e3414f-3357-4caa-8b29-ca7541c2774d]
So the Machinery document itself is not gone.
2. The embedded Insight is not saved
At the bottom of your screenshot, I see:
New Insight — Unsaved workbook
That means the Insight workbook inside the Machinery page is not saved yet. If you refresh, that embedded Insight view/configuration may disappear unless you click Save as inside that Insight panel.
So before refreshing, do this:
- Click the top Save button for
mine_process_1. - In the embedded Insight panel at the bottom, click Save as if you want to keep that workbook.
- Then try Ready to mine again.
- If the red error screen appears, click Show error and send me the expanded details.
Why the mined graph disappears
Clicking Ready to mine starts the mining aggregation. But because it errors immediately, the mined states/transitions are never successfully produced and confirmed. So after refresh, Foundry reloads the saved setup, but not the failed mining result.
Your source data still looks okay — the Claim object has data and the linked log object has valid transition rows. This looks more like a mining aggregation/UI failure than deleted data.
3 i clicked “ready to mine” again.. and seems it worked.. did you fix something?
No — I did not change or fix anything in the resource. I only inspected the saved Machinery graph and the underlying Ontology/log data.
What likely happened is that the earlier “Failed to load aggregation result” was a transient loading / aggregation / browser-state issue, and when you clicked Ready to mine again the aggregation succeeded.
Now that it worked, do these steps before refreshing:
- Click Confirm in the Mining configuration panel.
- Your screen says: Adding 7 states and 9 transitions.
- Until you click Confirm, those mined elements may not be added to the graph.
- After the graph updates, click the top Save button for
mine_process_1. - Wait until the save completes / the Save button no longer indicates unsaved changes.
- Then it should be safe to refresh or reopen.
Your saved Machinery resource is still:
:resource[ri.machinery.main.document.79e3414f-3357-4caa-8b29-ca7541c2774d]
So the important point is: Ready to mine only previews/adds mined results; Confirm + Save is what makes them persist in the document.
4 another confusing oudated section in the core beginner docs
let ai fix them.
FDE/GPT: Agreed. This is exactly the kind of thing AI should help fix: when the product UI changes, the speedrun docs should be corrected or at least annotated.
Here’s a clearer replacement for that section:
Updated instruction draft
Add the mined process graph to the Claims Process Application
-
Open Claims Process Application.
- Make sure you are in Workshop edit mode, not the published/view-only app.
- In edit mode, you should see builder controls such as Add widget, Set layout, section controls, and the left-side configuration panel.
- If you only see the running app with filters and a table, you are in view mode and cannot add widgets.
-
In the center panel labeled Process Explorer, click Add widget.
-
Choose the process graph / Machinery widget option.
-
Select your saved mined process graph, for example:
:resource[ri.machinery.main.document.79e3414f-3357-4caa-8b29-ca7541c2774d]
- Save the Workshop application.
And for the earlier OMA wording, I’d rewrite it as:
Updated OMA wording
The docs may refer to OMA, the Object Management Application. In the current UI, this is typically called Ontology Manager.
To inspect the Claim object type:
- Open Ontology Manager.
- Search for and open the Claim object type.
- Use the left navigation to inspect Overview, Properties, Datasources, and related link types.
- The transition log object should appear as
[Claim state] Log.
The key correction is:
The tutorial must explicitly distinguish Workshop view mode from Workshop edit mode. The Add widget button only appears in edit mode.
That one missing sentence would have saved you a lot of confusion.
Yes — this is enough to create a first useful summary + diagram. Your rough notes already show the real sequence. The main improvement is to organize it by Foundry tool/app and purpose, because the speedrun jumps between tools without explaining the map.
Below is a cleaned-up version you can use as the basis for your summary and diagram.
Speedrun 5: Mining Your First Business Process — Summary Draft
Goal
Build a Claims Process Application that shows how insurance claims move through states such as:
submitted → claimant extracted → data entry in progress → fields complete → approved / rejected / under investigation
The speedrun uses existing marketplace-installed data and ontology objects, then creates a Machinery process graph, embeds it into a Workshop application, and optionally creates an alert with Automate.
High-level tool map
| Step | Foundry tool | Purpose |
|---|---|---|
| 1 | Marketplace | Install the speedrun resources |
| 2 | Ontology Manager | Inspect Customer, Claim, and generated log object types |
| 3 | Object Explorer / Insight | Preview objects and understand data |
| 4 | Dataset preview | Inspect the raw claim logs dataset |
| 5 | Machinery | Configure and mine the process graph |
| 6 | Ontology Manager | Rename automatically created ontology artifacts |
| 7 | Workshop | Embed the process graph into the Claims Process Application |
| 8 | Workshop | Add filters, custom views, layout, publish |
| 9 | Automate | Create alert/automation |
Main resources involved
Input / source data
The raw claim log dataset:
:resource[ri.foundry.main.dataset.8127aae1-bc2c-4b3a-9ed9-b1bc4d2d7915]{branchName=”master”}
Important columns:
| Column | Meaning |
|---|---|
log_id |
Unique row/log identifier |
claim_id |
Claim/process identifier |
new_state |
New state of the claim |
timestamp |
Time when the claim reached that state |
Ontology object types
Customer object
:resource[ri.ontology.main.object-type.d2ccbb6f-d31d-4834-a9ee-96f6c497aa4c]
Used to represent customers/claimants.
Claim object
:resource[ri.ontology.main.object-type.4e9e8375-adf1-4fad-9bec-d94876386718]
This is the main process entity.
Each Claim has a State property. Machinery mines how claims move between states.
Generated Claim State Log object
You saw generated log objects like:
:resource[ri.ontology.main.object-type.e5ddda4e-1769-4aa5-829b-8782f970bf69]
and/or:
:resource[ri.ontology.main.object-type.8d14bd55-6e3f-4bb5-83a5-7cae0d6dd91b]
These represent the transition history used by Machinery.
Machinery graph
Your mined process graph:
:resource[ri.machinery.main.document.79e3414f-3357-4caa-8b29-ca7541c2774d]
This is the resource that gets embedded into the Workshop app.
Clean sequence of what happened
1. Install speedrun resources from Marketplace
The speedrun starts by installing prebuilt resources from Marketplace.
This creates or provides:
- Claim data
- Customer data
- Claim log data
- Ontology object types
- A starter Workshop application
- Resources needed for the process mining exercise
2. Inspect Customers and Claims
Using Ontology Manager, Object Explorer, and Insight, you inspect the main business objects.
Customer
Used to represent the claimant/customer.
Claim
Used as the main process object.
The Claim object has about 1,000 objects and includes properties such as:
- Claim ID
- Claim date
- Claimant ID
- Country
- High risk
- Letter
- State
- Type
- Value
The State property is the key process-state property used by Machinery.
3. Inspect Claim Logs
The claim log dataset contains historical state changes.
The key fields are:
claim_id
new_state
timestamp
Conceptually:
A claim_id tells us which process instance changed state.
new_state tells us what state it moved into.
timestamp tells us when that happened.
This historical log is what allows Foundry/Machinery to derive transitions between states.
4. Create Machinery process graph
In Machinery, you create a new process graph.
The process graph is configured with:
| Configuration area | Selected value |
|---|---|
| Process object | Claim |
| State property | State |
| Transition log object | [Claim state] Log |
| Old state | Old State |
| New state | New State |
| Timestamp | Timestamp |
Then you click Ready to mine.
Machinery computes the process graph from the claim state history.
The mined result included:
7 states
9 transitions
Example states:
submitted
claimant extracted
data entry in progress
fields complete
approved
rejected
under investigation
Important UI behavior:
Ready to mine → preview mining result
Confirm → add mined states/transitions to graph
Save → persist the Machinery graph
This was a major source of confusion because Ready to mine is not the same as Save.
5. Rename generated ontology artifacts
The speedrun then asks you to rename automatically created ontology artifacts.
The docs refer to OMA, but in the current UI this is Ontology Manager.
So the correct translation is:
OMA = Object Management Application = Ontology Manager
In Ontology Manager, you inspect or rename the generated log object type, such as:
[Claim state] Log
This object type is linked to Claim and represents claim state transition logs.
6. Open Claims Process Application in Workshop edit mode
The next step happens in Workshop, not Machinery and not Ontology Manager.
The Workshop app is called:
Claims Process Application
Important distinction:
| Mode | What you can do |
|---|---|
| View mode | Use the app only |
| Edit mode / builder mode | Add widgets and configure layout |
The docs say:
In the center of the application, hit the Add Widget button.
But this only appears in Workshop edit mode.
In edit mode, the center section has a placeholder labeled something like:
Process Explorer
Embed your process here!
You click Add widget there and add the process graph / embedded resource / Machinery graph.
7. Embed the Machinery graph into Workshop
In the Workshop app:
- Open the app in edit mode.
- Select the center process section.
- Click Add widget.
- Add the process graph / Machinery resource.
-
Select the saved Machinery graph:
:resource[ri.machinery.main.document.79e3414f-3357-4caa-8b29-ca7541c2774d]
- Save the Workshop app.
This creates the final app layout:
Left: filters
Center: process graph
Bottom: filtered claims object table
8. Explore and customize the Workshop app
The later speedrun steps are about using and improving the app.
These include:
| Step | Purpose |
|---|---|
| Explore / layout graph | Adjust how the process graph appears |
| Explore / process | Use the graph to understand claim flows |
| Explore / filtering claims | Filter claims based on process criteria |
| Workshop app / custom view | Customize how claims are displayed |
| Workshop app / save and publish | Save and publish the final application |
9. Create alert with Automate
The final step uses Automate to create an alert.
Conceptually:
If certain claim/process conditions are met,
then notify or trigger an alert.
This uses the process app and ontology objects operationally.
Diagram draft
You can use this as your first diagram.
02 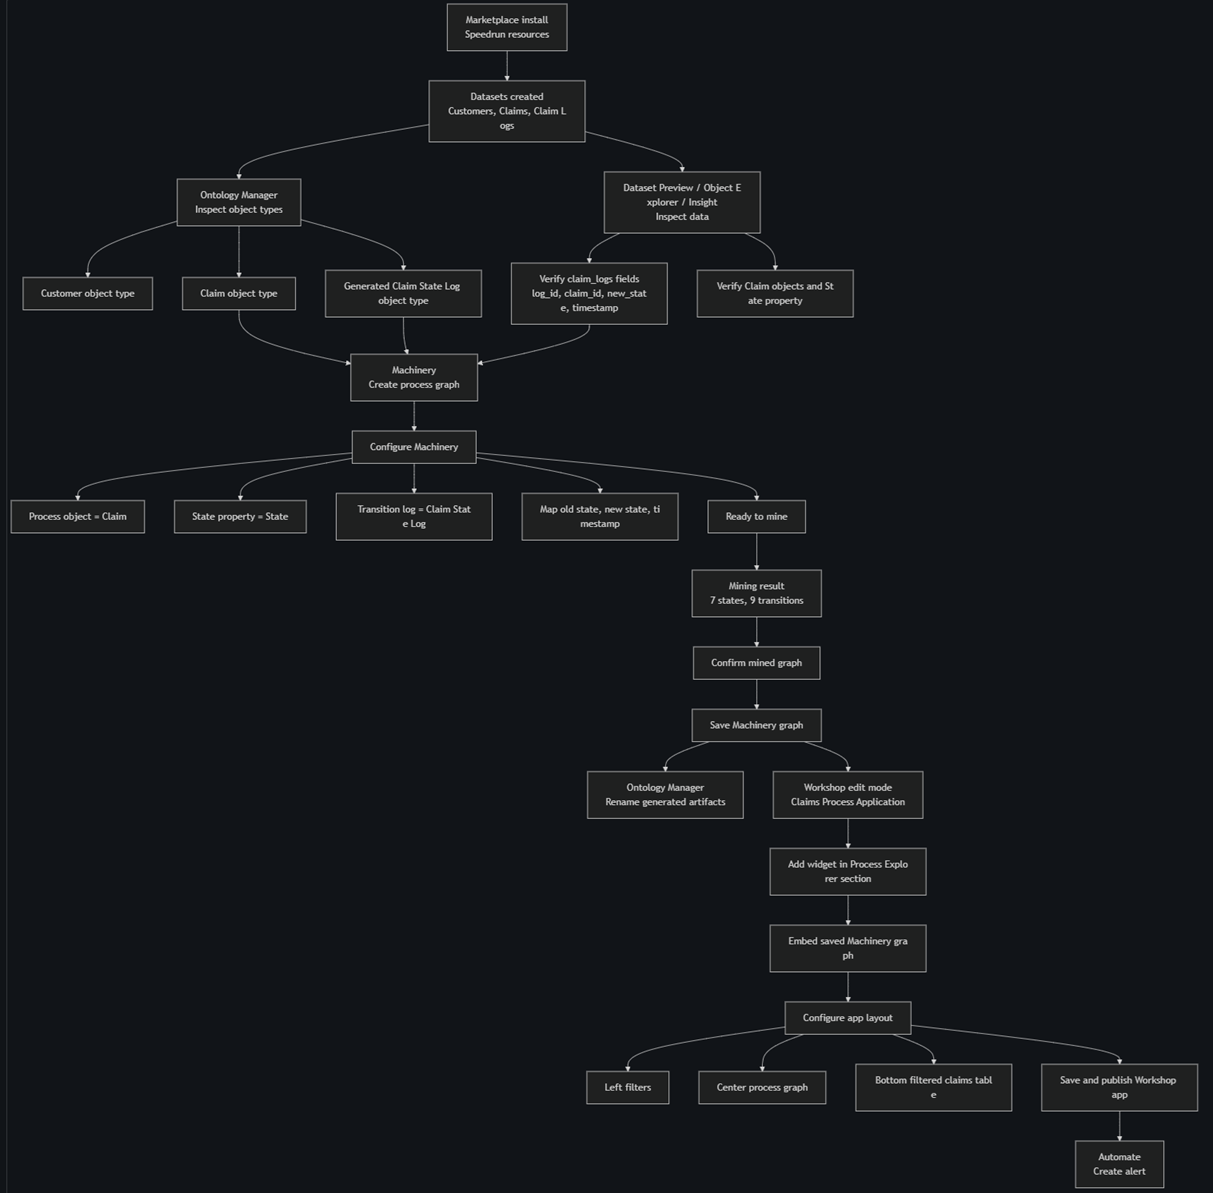
Even simpler architecture diagram
This one is better for explaining the overall concept.
01 
Important UI translation table
This may be the most useful part of your summary because the docs are confusing.
| Docs wording | Current UI / actual meaning |
|---|---|
| OMA | Ontology Manager |
| Open the application | Could mean view mode or edit mode |
| Add Widget | Only visible in Workshop edit mode |
| Process graph | Machinery graph / process graph resource |
| Ready to mine | Run mining calculation |
| Confirm | Add mined states/transitions to the graph |
| Save | Persist the resource |
| Claims Process Application | Workshop app/module |
| Object table | Workshop object table |
| Link types graph | Related object/link view in Ontology Manager |
Suggested final document structure
You could structure your summary like this:
1. Purpose of the speedrun
2. Main Foundry tools used
   2.1 Marketplace
   2.2 Ontology Manager
   2.3 Object Explorer / Insight
   2.4 Dataset Preview
   2.5 Machinery
   2.6 Workshop
   2.7 Automate

3. Data and ontology model
   3.1 Customers
   3.2 Claims
   3.3 Claim logs
   3.4 Generated claim state log object

4. Building the process graph
   4.1 Configure process object
   4.2 Configure transition log
   4.3 Mine graph
   4.4 Confirm and save

5. Embedding the graph in Workshop
   5.1 Open Workshop edit mode
   5.2 Add process graph widget
   5.3 Configure filters and claim table
   5.4 Save and publish

6. Alerting with Automate

7. UI translation / pitfalls
Missing information that would improve the diagram
Your draft is already enough for a first version. If you want a more precise final diagram, the useful missing pieces are:
- Exact final name of the renamed log object type.
- Exact widget name you selected in Workshop to embed the Machinery graph.
- Whether the alert in Automate used:
- high-risk claims,
- a specific state,
- overdue claims,
- rejected claims,
- or some other condition.
- Final published app name/version.
- Any final custom view name created in Workshop.
But you do not need those to make a good first summary. The flow above is already the core story.
Yes — absolutely possible.
For Speedrun: Mining Your First Business Process, the equivalent “single summary diagram” should probably show the whole end-to-end journey, not just one screen. The best central image would be the final Workshop Claims Process Application, with callouts around it for the major stages.
Your diagram should answer:
“What tools did I use, in what order, and what did each one produce?”
Recommended single-summary diagram structure
Use the final Claims Process Application as the center screenshot:
┌──────────────────────────────────────────────────────────────────────┐
│                  Claims Process Application / Workshop                │
│                                                                      │
│   ┌───────────────┐     ┌──────────────────────────────┐             │
│   │ Filters       │     │ Process Explorer              │             │
│   │               │     │ Embedded Machinery Graph      │             │
│   └───────────────┘     └──────────────────────────────┘             │
│                                                                      │
│   ┌────────────────────────────────────────────────────┐             │
│   │ Filtered Claims Object Table                        │             │
│   └────────────────────────────────────────────────────┘             │
└──────────────────────────────────────────────────────────────────────┘
Then put numbered callout boxes around it:
5.2.s1  Marketplace install
5.2.s2  Inspect Customers and Claims
5.2.s3  Inspect Claim Logs
6.2.s1  Add Machinery process graph
6.2.s2  Configure process mining
6.3.s1  OMA = Ontology Manager
6.3.s2  Rename generated ontology artifacts
7.2.s1  Set up Workshop app
7.3.s1  Explore layout graph
7.3.s2  Explore process
7.3.s4  Filter claims
7.4.s1  Create custom view
7.4.s2  Save and publish app
7.5.s1  Create alert in Automate
Draft single-page diagram content
You could title it:
Speedrun: Mining Your First Business Process — End-to-End Summary
Then show this flow:
01 
That is the process flow diagram.
But if you want something more like the example screenshot you showed — one app screenshot with labeled boxes — I would design it like this:
Visual layout for your final diagram
┌─────────────────────────────────────────────────────────────────────────────┐
│  5.2.s1 Marketplace Install                                                 │
│  Installs starter data, ontology objects, Workshop app, and resources        │
└───────────────────────────────┬─────────────────────────────────────────────┘
                                │
                                ▼

┌─────────────────────────────────────────────────────────────────────────────┐
│  5.2.s2 / 5.2.s3 Data + Ontology Inspection                                  │
│                                                                             │
│  Ontology Manager: Customer, Claim                                           │
│  Object Explorer / Insight: preview objects                                  │
│  Dataset Preview: claim_logs                                                 │
│                                                                             │
│  claim_logs fields: log_id, claim_id, new_state, timestamp                   │
└───────────────────────────────┬─────────────────────────────────────────────┘
                                │
                                ▼

┌─────────────────────────────────────────────────────────────────────────────┐
│  6.2.s1 / 6.2.s2 Machinery                                                   │
│                                                                             │
│  Create process graph                                                        │
│  Process object = Claim                                                      │
│  State property = State                                                      │
│  Transition log = [Claim state] Log                                          │
│  Mine result = 7 states, 9 transitions                                       │
│                                                                             │
│  Ready to mine → Confirm → Save                                              │
└───────────────────────────────┬─────────────────────────────────────────────┘
                                │
                                ▼

┌─────────────────────────────────────────────────────────────────────────────┐
│  6.3.s1 / 6.3.s2 Ontology Manager                                            │
│                                                                             │
│  Docs say OMA, current UI says Ontology Manager                              │
│  Rename generated ontology artifacts                                         │
│  Verify Claim ↔ [Claim state] Log link                                       │
└───────────────────────────────┬─────────────────────────────────────────────┘
                                │
                                ▼

┌─────────────────────────────────────────────────────────────────────────────┐
│  7.2.s1 - 7.4.s2 Workshop                                                    │
│                                                                             │
│  Claims Process Application                                                  │
│                                                                             │
│  ┌───────────────┐   ┌──────────────────────────────────────┐                │
│  │ Filters       │   │ Process Explorer                     │                │
│  │               │   │ Embedded Machinery process graph     │                │
│  └───────────────┘   └──────────────────────────────────────┘                │
│                                                                             │
│  ┌─────────────────────────────────────────────────────────┐                 │
│  │ Filtered Claims object table                            │                 │
│  └─────────────────────────────────────────────────────────┘                 │
│                                                                             │
│  Add widget → Embed graph → Explore → Custom view → Save and publish         │
└───────────────────────────────┬─────────────────────────────────────────────┘
                                │
                                ▼

┌─────────────────────────────────────────────────────────────────────────────┐
│  7.5.s1 Automate                                                             │
│  Create alert based on claim/process conditions                              │
└─────────────────────────────────────────────────────────────────────────────┘
Better single-slide version
If you want it to look like your example image, I would make the center of the slide the final Workshop app, then put callouts around it like this:
┌───────────────────────────────────────────────┐
│ 5.2.s1 Marketplace Install                     │
│ Starter data, ontology, app resources          │
└───────────────────────────────────────────────┘

┌───────────────────────────────────────────────┐
│ 5.2.s2 Inspect Customers / Claims              │
│ Ontology Manager, Object Explorer, Insight     │
└───────────────────────────────────────────────┘

┌───────────────────────────────────────────────┐
│ 5.2.s3 Inspect Claim Logs                      │
│ claim_id, new_state, timestamp                 │
└───────────────────────────────────────────────┘


                 ┌──────────────────────────────────────────────┐
                 │ Claims Process Application                    │
                 │ Workshop edit mode / final app                │
                 │                                              │
                 │  ┌─────────┐  ┌──────────────────────────┐   │
                 │  │ Filters │  │ Process Explorer          │   │
                 │  │         │  │ Machinery process graph   │   │
                 │  └─────────┘  └──────────────────────────┘   │
                 │                                              │
                 │  ┌────────────────────────────────────────┐  │
                 │  │ Filtered Claims object table            │  │
                 │  └────────────────────────────────────────┘  │
                 └──────────────────────────────────────────────┘


┌───────────────────────────────────────────────┐
│ 6.2.s1 / 6.2.s2 Machinery                      │
│ Configure process mining                       │
│ Claim + State + Claim State Log                │
│ Result: 7 states, 9 transitions                │
└───────────────────────────────────────────────┘

┌───────────────────────────────────────────────┐
│ 6.3.s1 / 6.3.s2 Ontology Manager               │
│ OMA in docs = Ontology Manager                 │
│ Rename generated artifacts                     │
└───────────────────────────────────────────────┘

┌───────────────────────────────────────────────┐
│ 7.2.s1 - 7.4.s2 Workshop                       │
│ Add widget, embed graph, filter, custom view,  │
│ save and publish                               │
└───────────────────────────────────────────────┘

┌───────────────────────────────────────────────┐
│ 7.5.s1 Automate                                │
│ Create alert                                   │
└───────────────────────────────────────────────┘
Suggested callout labels
For a single final diagram, I would use these exact callout titles:
| Callout | Label |
|---|---|
| 1 | 5.2.s1 Marketplace install |
| 2 | 5.2.s2 Inspect Customer + Claim objects |
| 3 | 5.2.s3 Inspect claim logs |
| 4 | 6.2.s1 Add Machinery process graph |
| 5 | 6.2.s2 Configure process mining |
| 6 | 6.3.s1 OMA = Ontology Manager |
| 7 | 6.3.s2 Rename generated artifacts |
| 8 | 7.2.s1 Set up Workshop app |
| 9 | 7.3.s1 Explore graph layout |
| 10 | 7.3.s2 Explore process |
| 11 | 7.3.s4 Filter claims |
| 12 | 7.4.s1 Create custom view |
| 13 | 7.4.s2 Save and publish |
| 14 | 7.5.s1 Create alert in Automate |
Recommended final diagram title
I would title it:
Speedrun: Mining Your First Business Process — One-Page Flow
Subtitle:
Marketplace → Ontology Manager → Dataset Preview → Machinery → Workshop → Automate
That subtitle alone explains the “byzantine UI” better than the original docs.
Key note to include on the diagram
I would add a small warning box:
Important UI translations:
- OMA = Ontology Manager
- Add Widget appears only in Workshop edit mode
- Ready to mine previews the process graph
- Confirm + Save persists the graph
That warning box is very important because those were the confusing parts.
So yes — this is completely possible, and your summary diagram would probably be more useful than the original speedrun page.
26.0718 (v1 26.0717)