7 Create UI
← 6 Display in Maps / ↑ 3.2 Foundry QS0 / → 8 HN algorithm description
Converted 2026-11-19 04:40 PM EST
TOC
- 7.0 For this tutorial, I would recommend a small Workshop app with a Map widget.
- 7.1 Create the Workshop module
- 7.2 Start with the results table
- 7.3 Add the map
- 7.4 Save and publish this version
7.0 For this tutorial, I would recommend a small Workshop app with a Map widget.
Not because it eliminates configuration, but because we can configure it once and give the reader a focused interface.
| Option | Best fit |
|---|---|
| Maps—the app we just used | Open-ended geospatial investigation, with many display controls |
| Workshop + Map widget | A purpose-built screen: results table, map, and selected-object details |
| Quiver + Map card | Exploring objects through maps alongside analytical charts |
Foundry documents Workshop’s Map widget and Quiver’s Map card as alternatives for visualizing Ontology data.
Use geospatial data in the Ontology / How to visualize, explore, and publish geospatial data
My recommendation
Keep today’s Maps result as the completed exercise. Save it as QS0_ResultMap in QS0_Build.
Then add a North extension using Workshop:
-
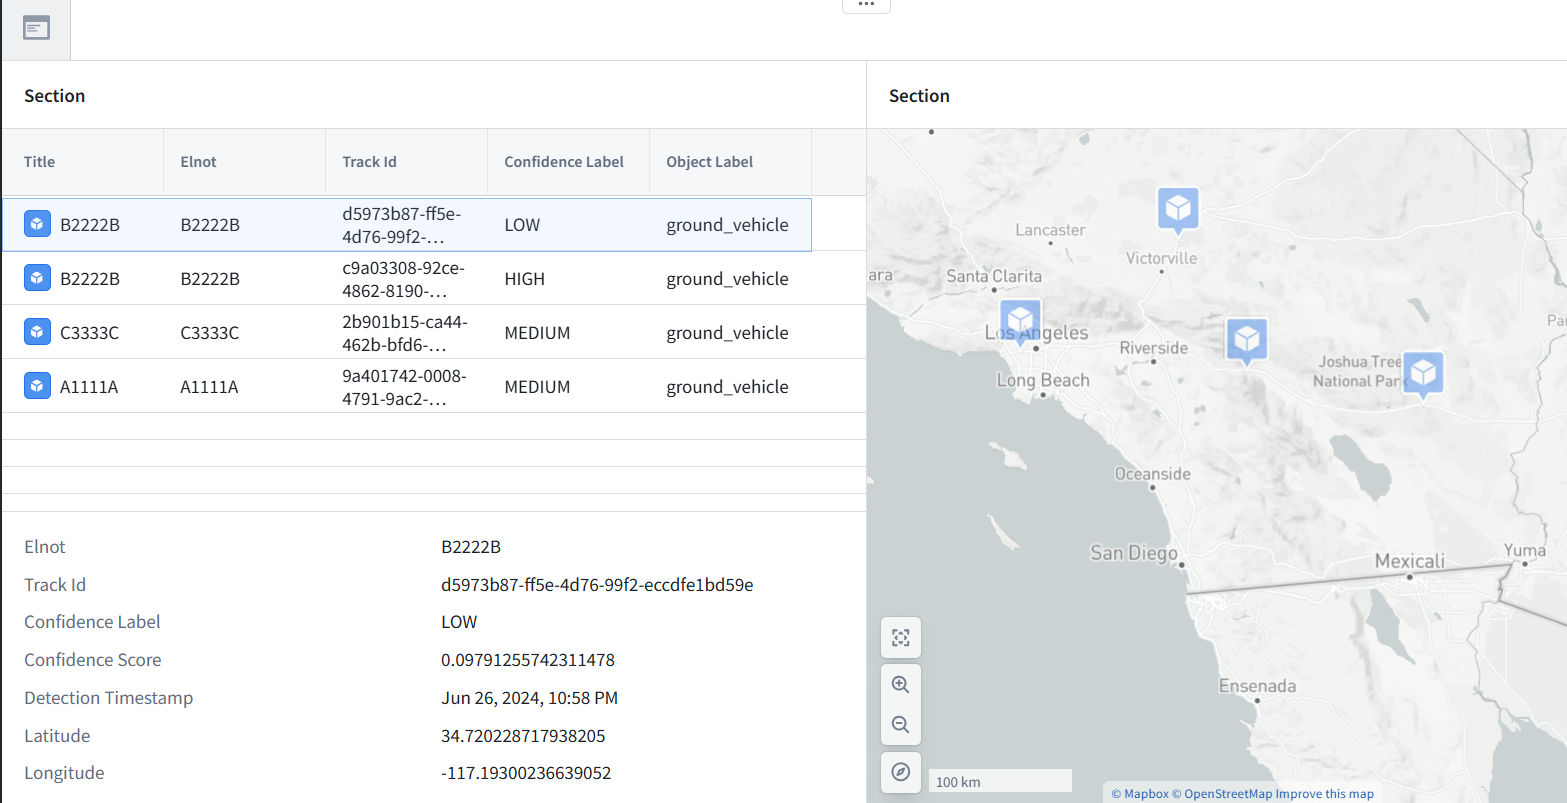
Results table: four needles.
-
Map: clearly sized point markers and optional ELINT shapes.
-
Details: properties of the selected needle.
That would also demonstrate your NES idea: the same Equator objects, presented through a different North application.
North extension: Display the needles in Workshop
What we will build: A small Workshop UI using the four objects we already created:
-
Results table: lists the detected needles.
-
Map: displays their locations.
-
Details: shows the selected object’s properties.
No new pipeline or dataset is needed.
7.1 Create the Workshop module
1. Open QS0_Build (project).
2. Click New → Workshop. If Workshop is not listed, open it from Applications.
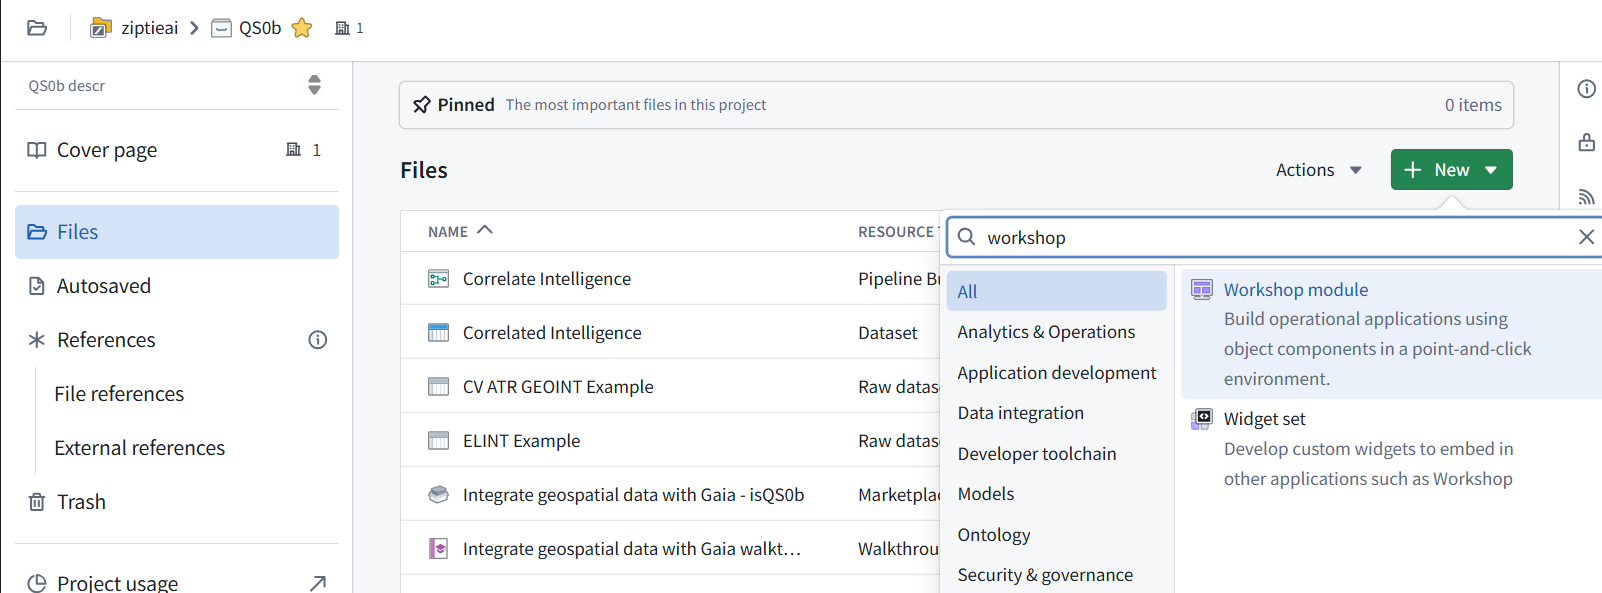
3. Create a Blank module named:
QS0_NeedleViewer
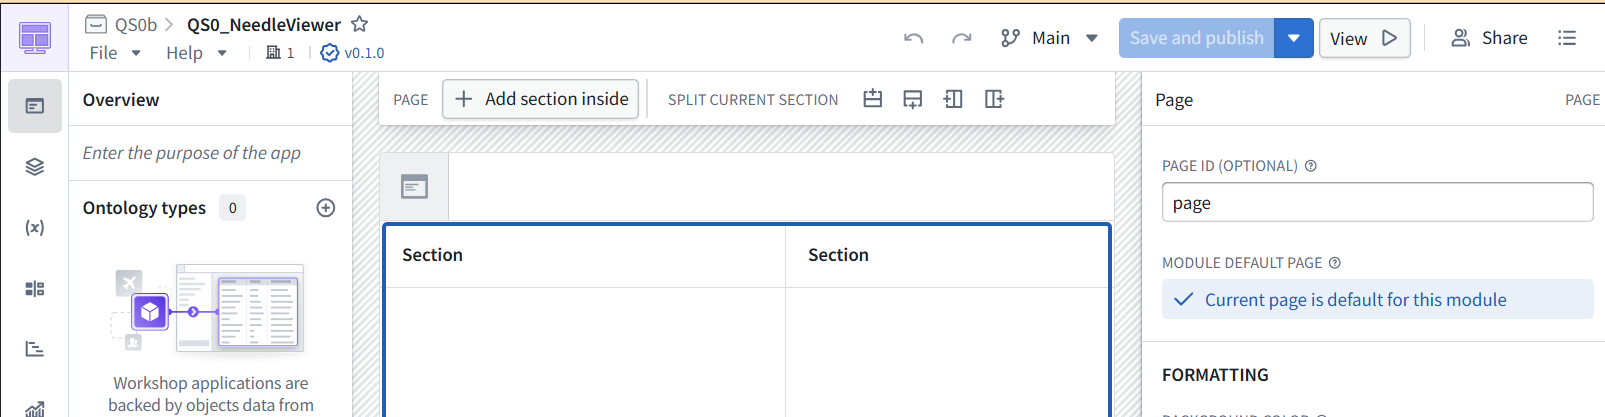
4. Save it in QS0_Build.
7.2 Start with the results table
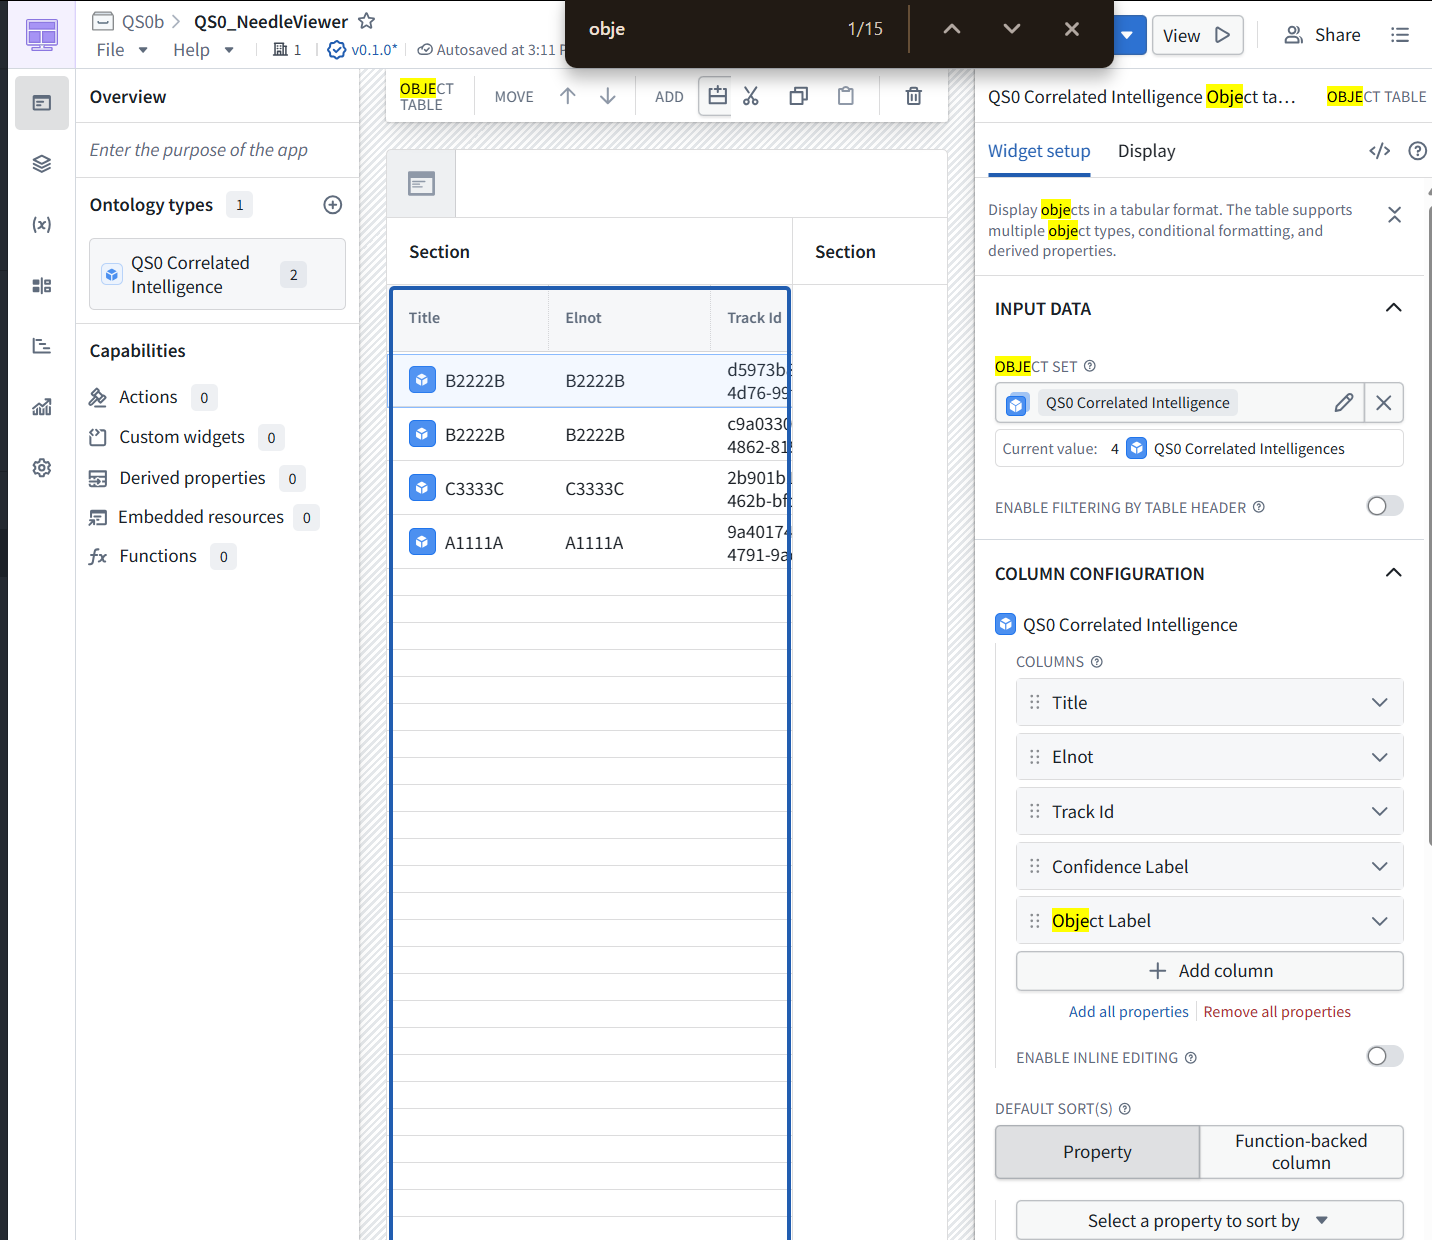
1. Add an Object table widget.
2. Set its input to all objects of QS0 Correlated Intelligence. Do not choose Correlated Intelligence QS0b or another earlier installation.
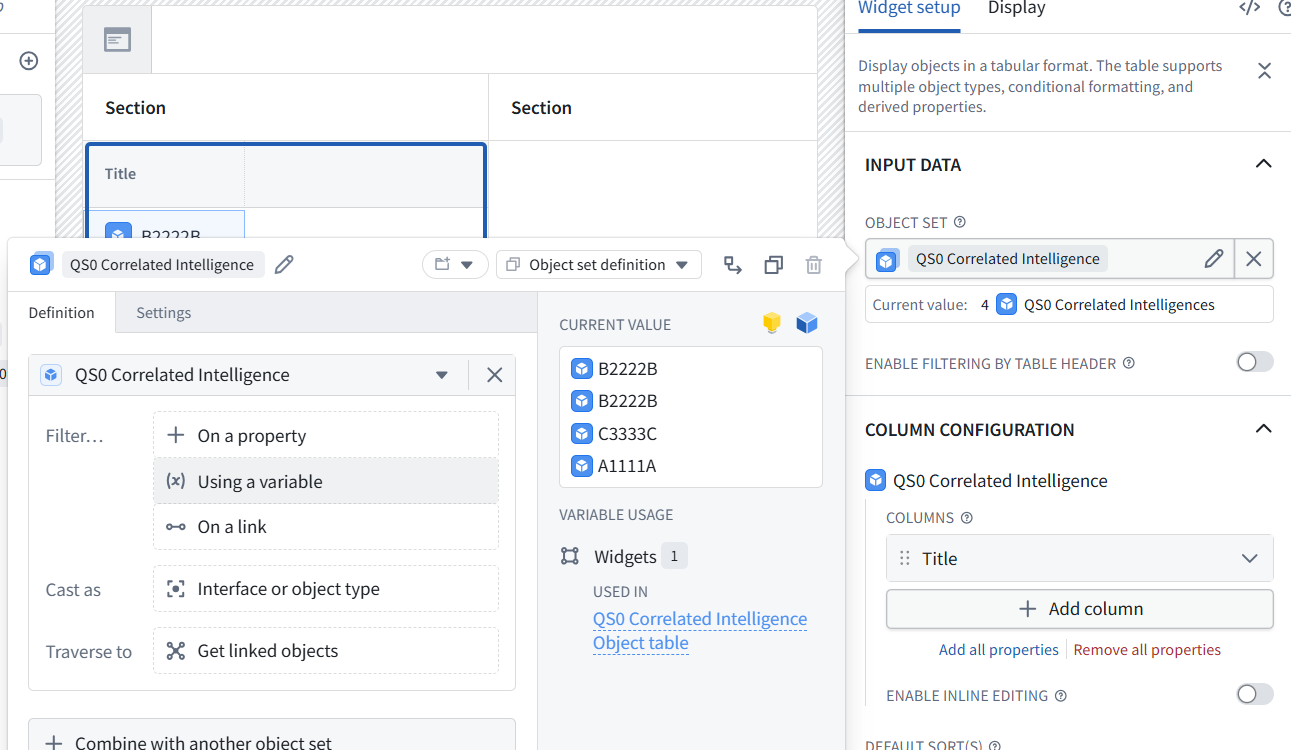
3. Display:
-
Elnot
-
Track Id
-
Confidence Label
-
Object Label
4. Enable single-object active selection.
Checkpoint: the table should contain four objects, including two titled B2222B with different Track Ids.
Stop there and show the editor when you return. Next we’ll add the Map widget using Geo Hash for point locations, then connect table selection to the details display.
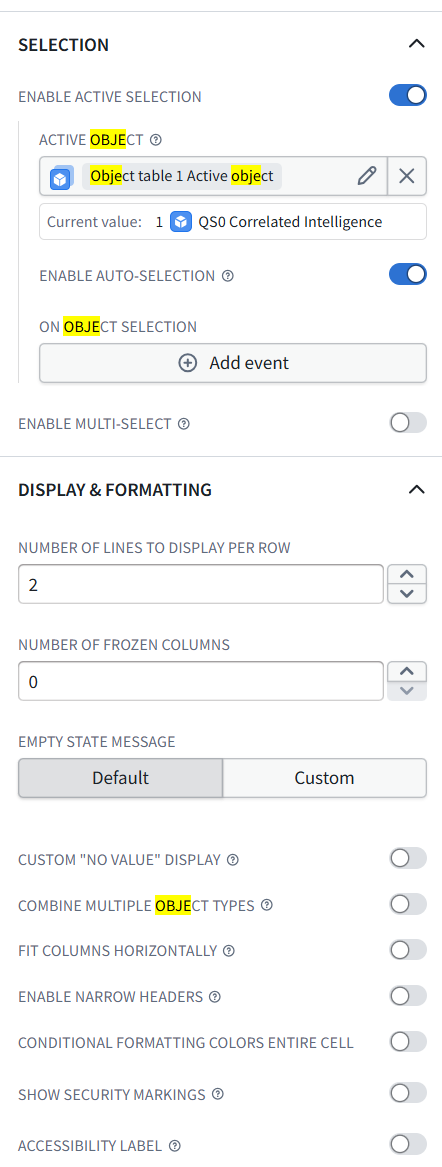
Already configured correctly—no changes needed:
-
Active selection: ON
-
Auto-selection: ON
-
Multi-select: OFF
Object table 1 Active object holds the selected row’s object. We’ll use it for the details panel later; leave On object selection → Add event empty.
7.3 Add the map
1. Click the empty right-hand Section, add a Map widget, and show its Widget setup panel. The map will display all four objects, not just the selected row.
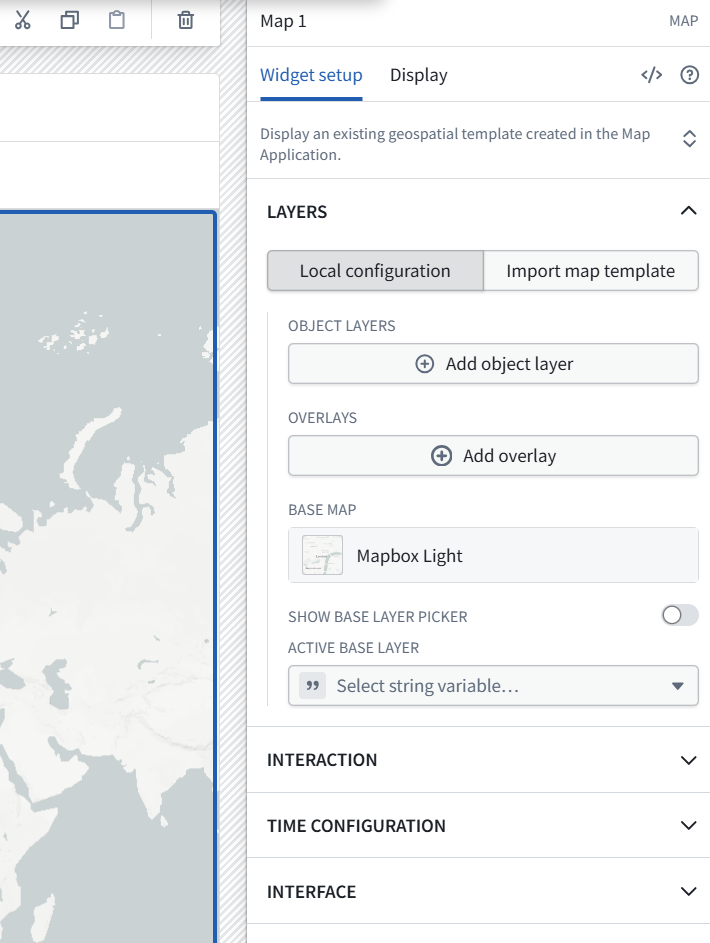
The Map widget is ready. Keep Local configuration selected—we’ll configure this map directly rather than import the earlier map.
2. Click Add object layer.
3. For its Object set, select the existing QS0 Correlated Intelligence variable—the same one feeding the table, with 4 objects. Do not select Object table 1 Active object, which contains only the selected object.
4. Show the layer settings that open. We’ll use Geo Hash for the point locations.
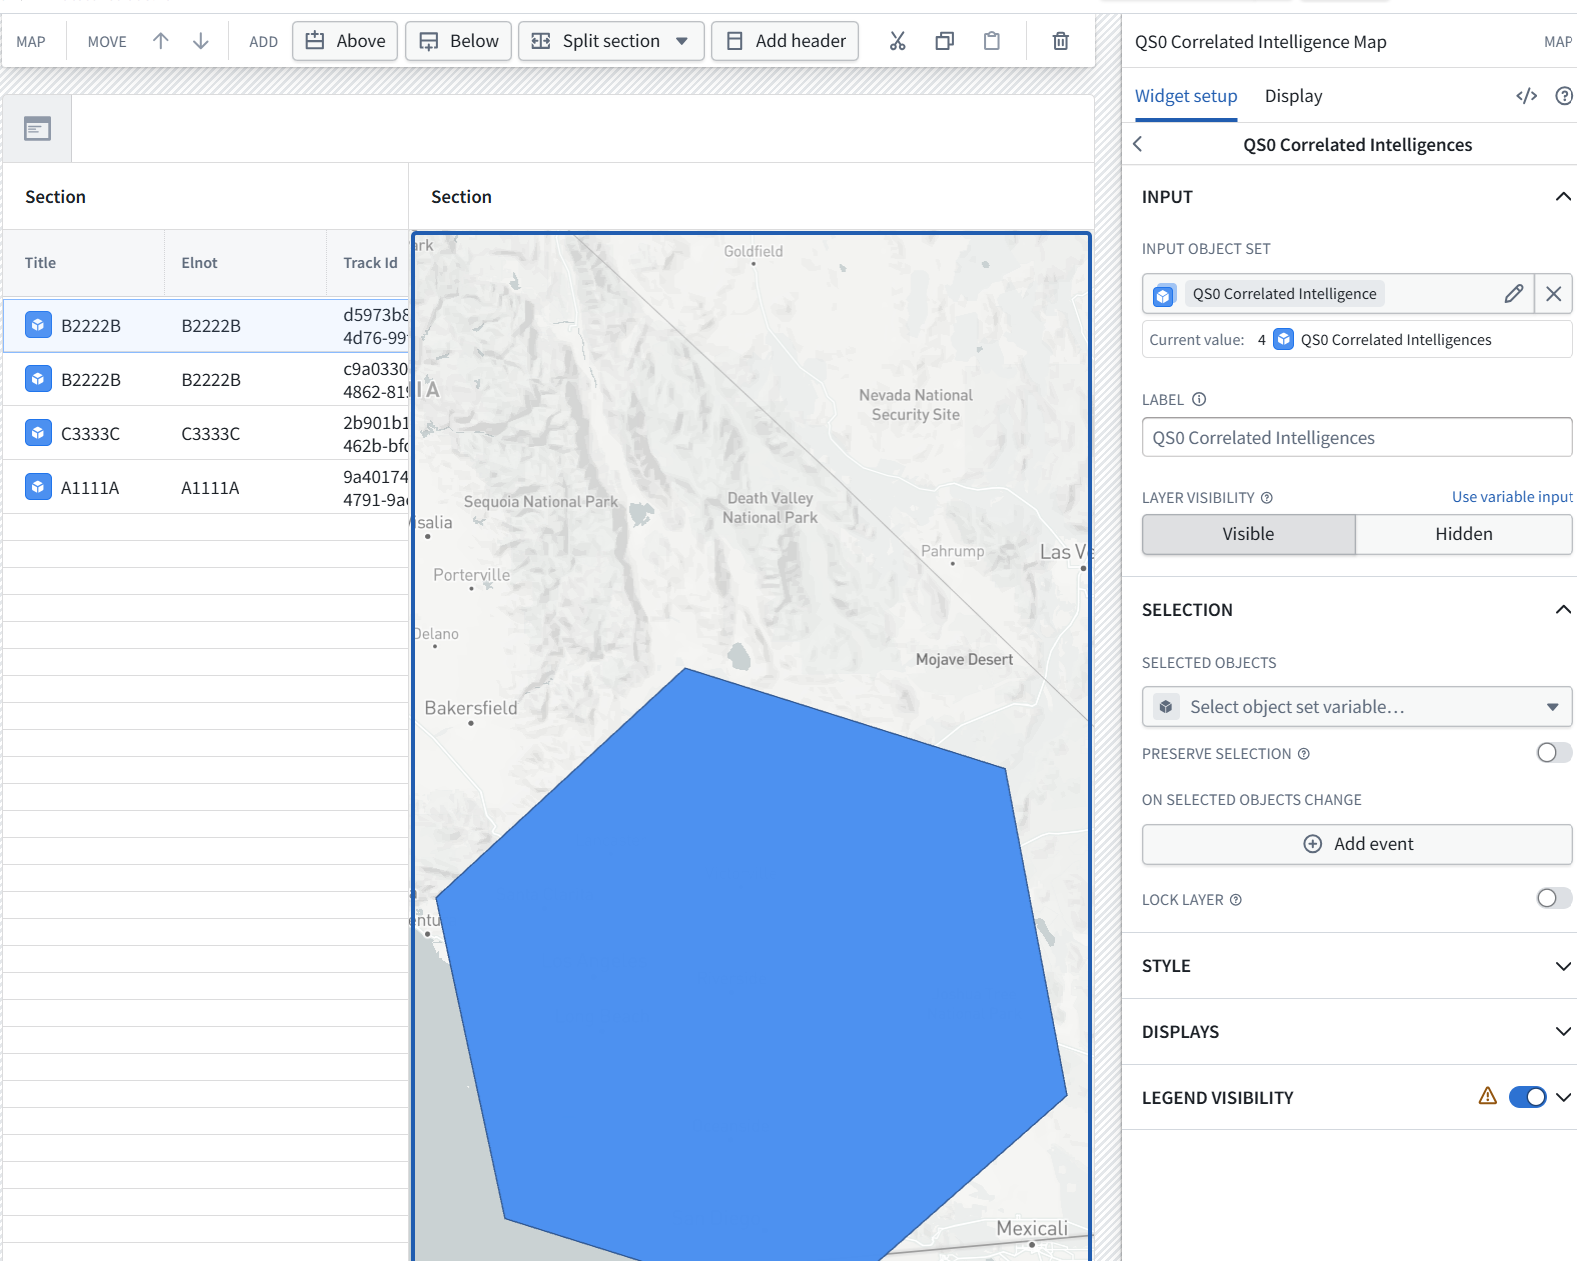
The layer correctly contains all four objects. It has automatically chosen the large H3 geometry, as Maps did earlier.
5. In the right-hand configuration panel:
-
Expand DISPLAYS, near the bottom.
-
Show the display settings.
We’ll configure Geo Hash as point markers and remove the H3 polygon display. Leave the Selection settings unchanged for now.
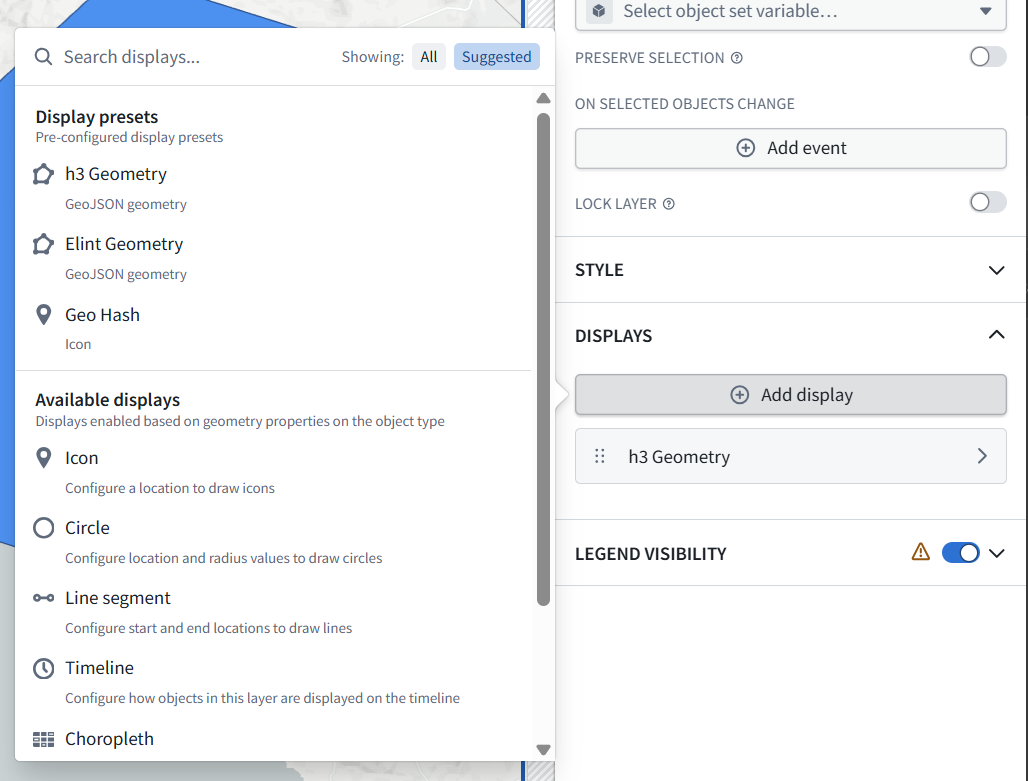
6. Select Geo Hash under Display presets—the option labeled Icon.
7. After it is added, hover over the existing h3 Geometry display row.
If a remove control appears, show it before clicking. We want to remove only the H3 display, keeping the object layer and the new point markers.
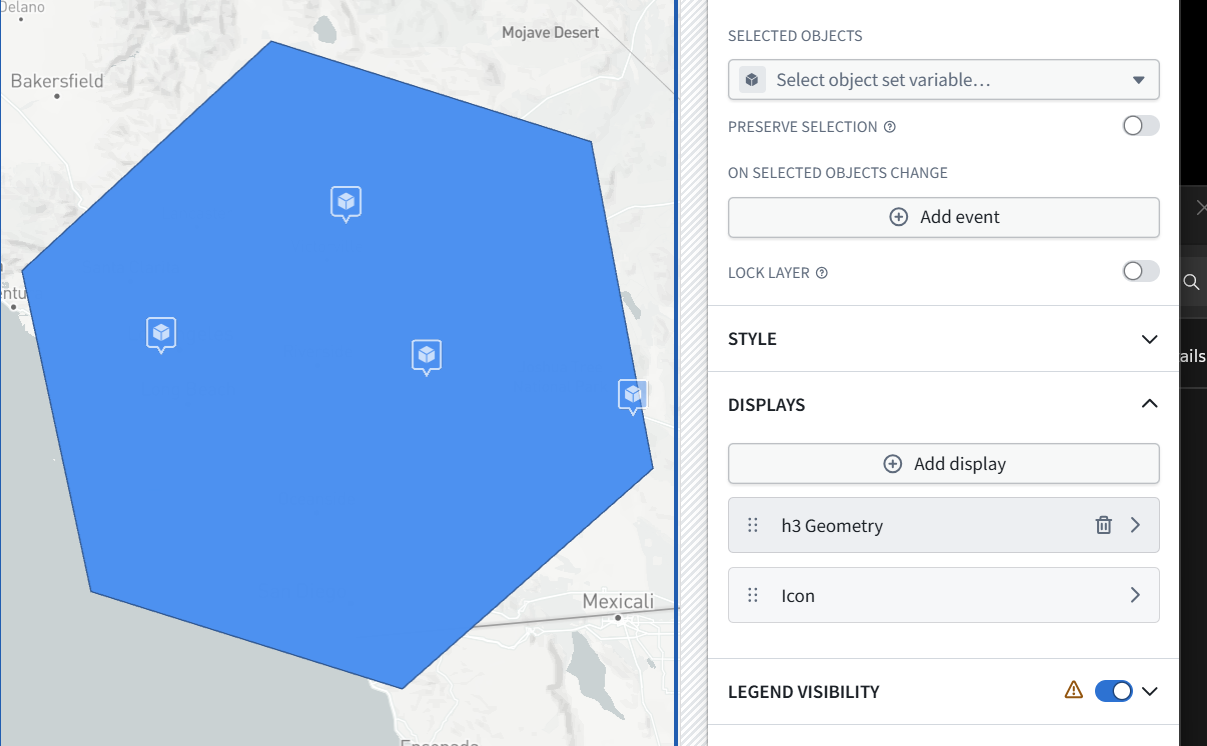
8. Click the trash-can icon on the h3 Geometry row.
9. This removes only that display configuration—not the property, objects, or data.
10. Keep the Icon row. The large blue hexagon should disappear, leaving the four point markers.
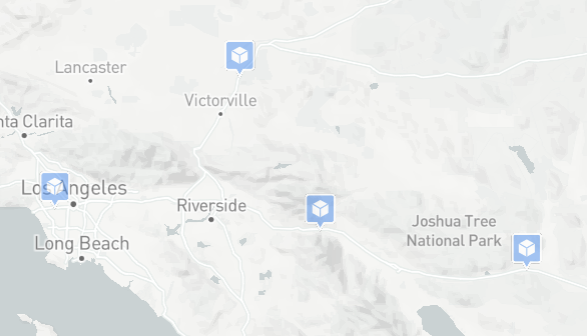
Correct—all four point markers are visible, with the H3 polygon removed.
Next: show the selected needle’s details
11. Add a Property list widget below the results table in the left section.
12. Set Input object set to Object table 1 Active object—the selected table row.
13. Add these properties:
-
Elnot
-
Track Id
-
Confidence Label
-
Confidence Score
-
Detection Timestamp
-
Latitude
-
Longitude
14. Click different table rows and verify that the details update. The map should continue displaying all four objects. Show the resulting layout.
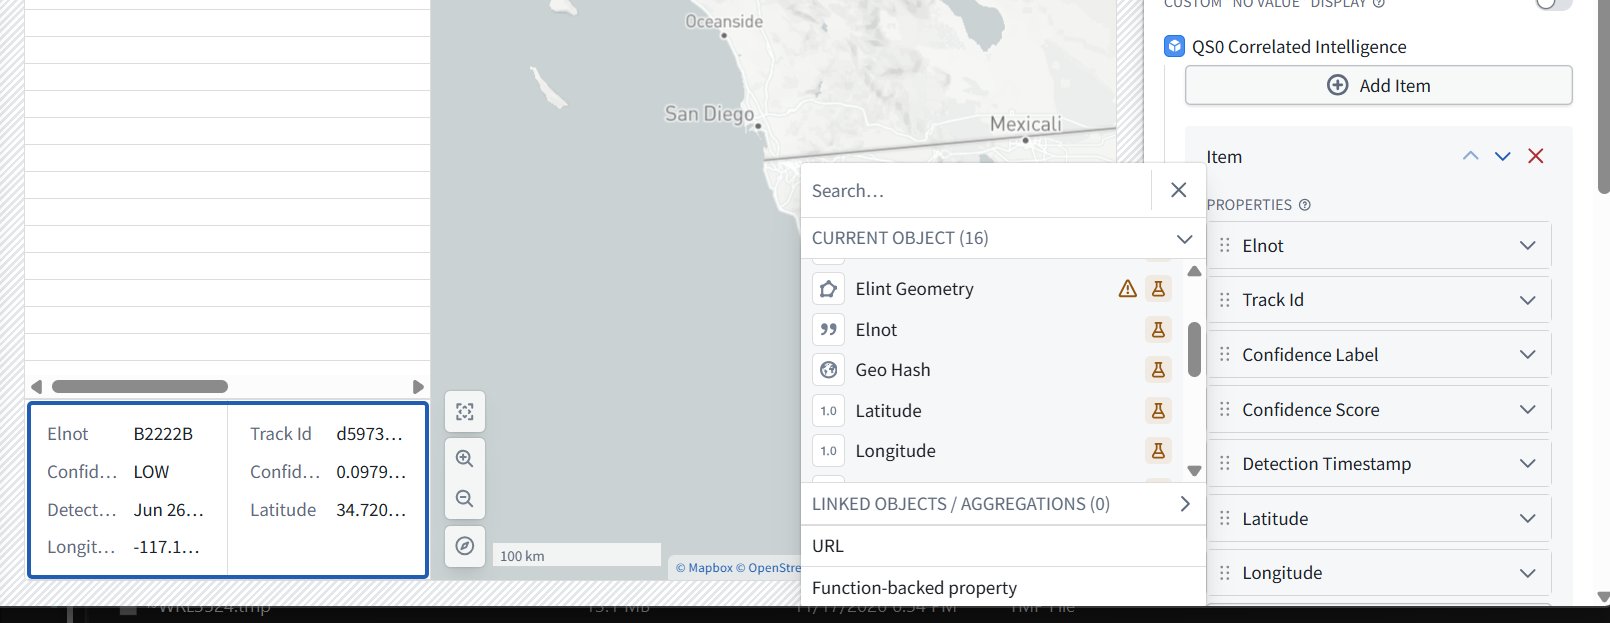
The details panel works: switching between the two B2222B rows changes the Track Id, confidence, timestamp, and coordinates.
Make the details readable
15. Select the Property list widget—the left-tree entry beginning Object table 1 Active object….
16. Under Widget setup → Item, change Number of columns from 2 to 1. This gives labels and values more space.
17. You can also rename that widget Needle details in the Layout tree.
18. Then Save and publish → View and verify:
-
All four markers remain on the map.
-
Selecting a table row updates Needle details.
Map-marker highlighting is not linked to table selection yet; that can be a separate extension.
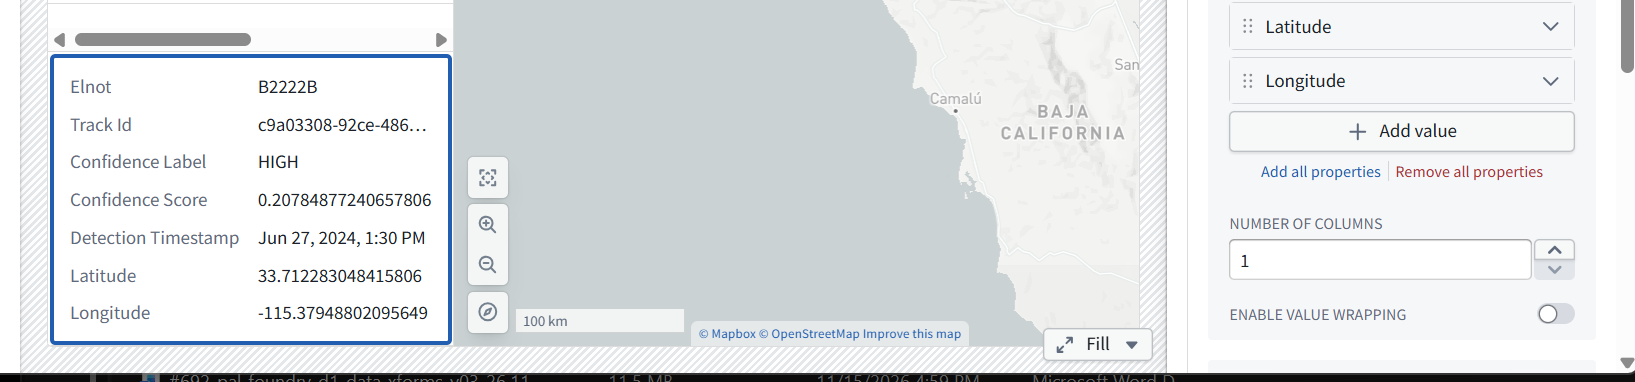
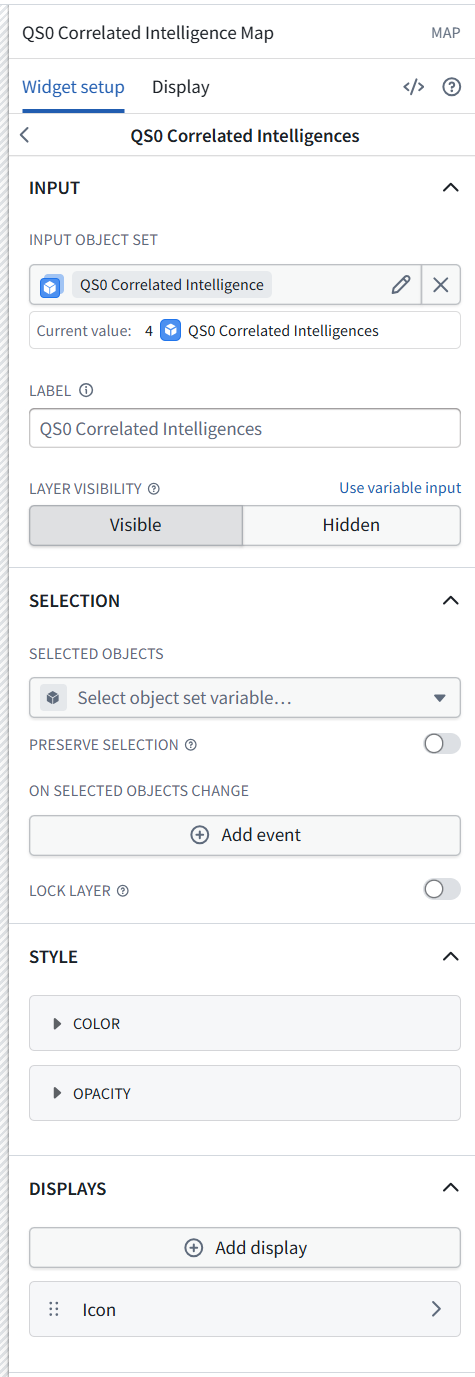
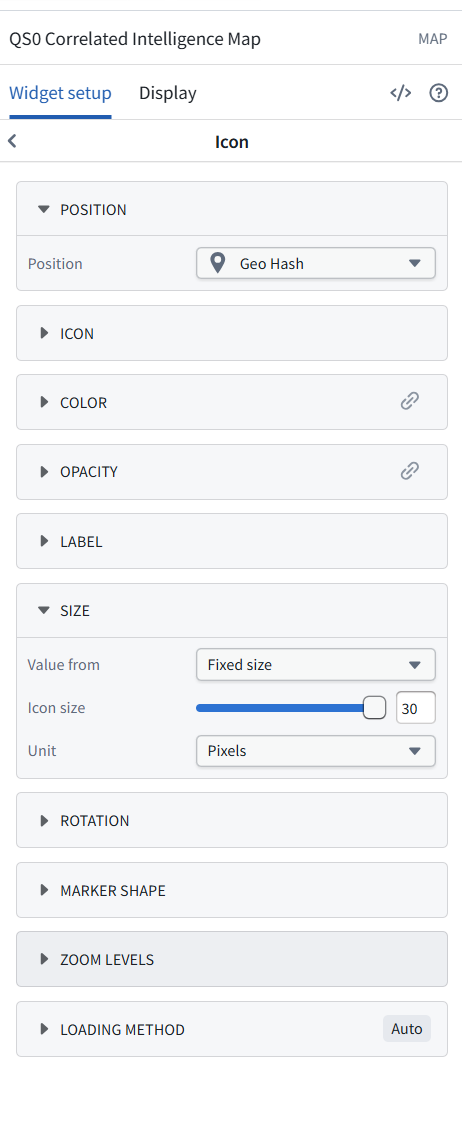
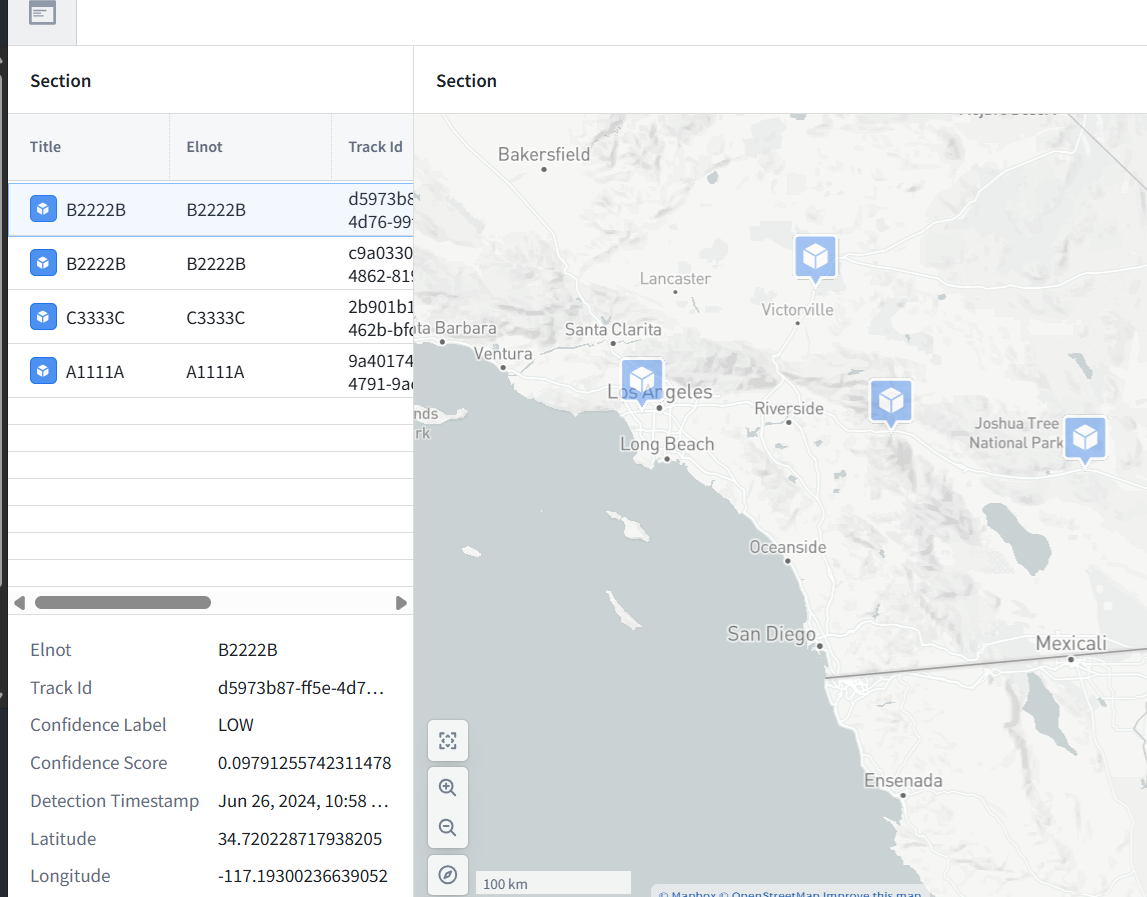
All four markers are visible now. The configuration is correct:
-
Layer input: all four objects
-
Icon position: Geo Hash
-
Icon size: 30 pixels
-
Details input: the selected table row
The earlier blank view was a viewport/zoom issue, not missing data.
7.4 Save and publish this version
Then reopen View to check whether it retains this useful regional extent. If it resets to Los Angeles again, we’ll configure the map’s initial viewport explicitly.
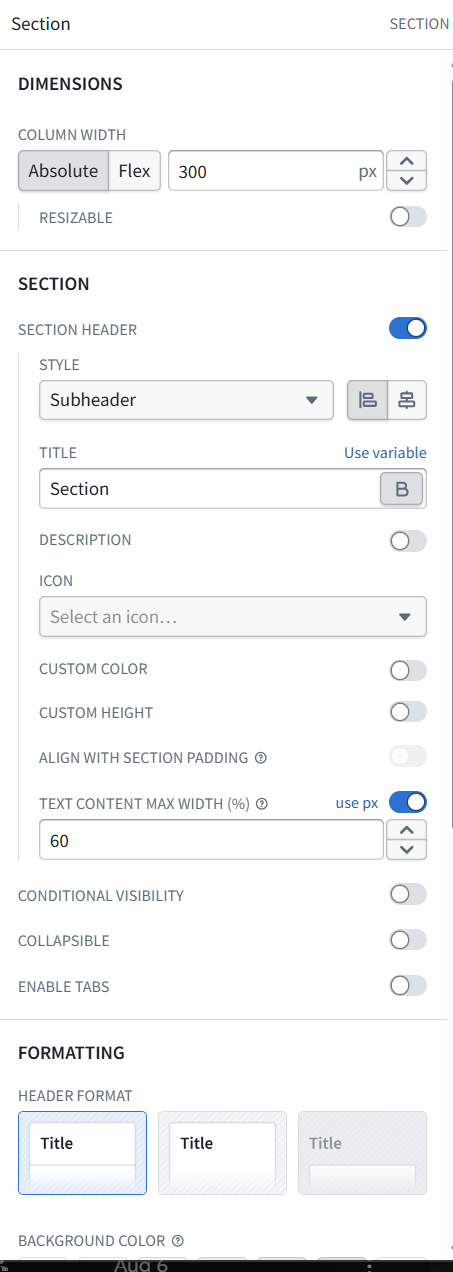
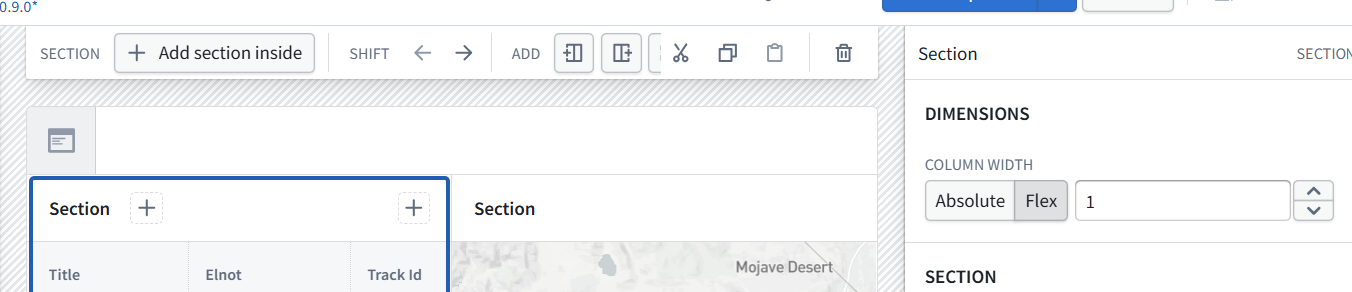
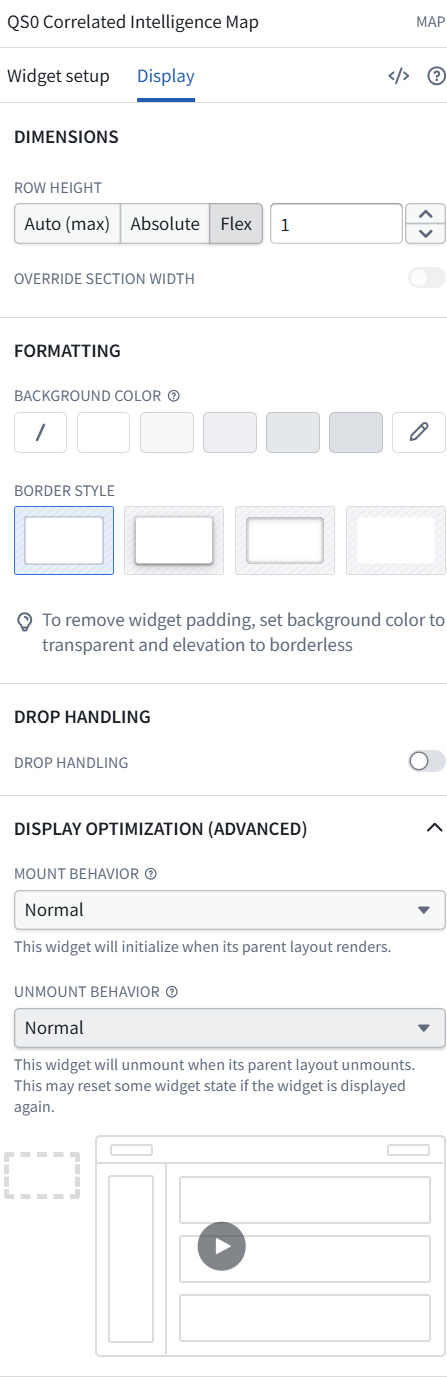
question: the left table is too narrow …. how to make it wider?