8 HN algorithm description
← 7 Create UI / ↑ 3.2 Foundry QS0
Converted 2026-11-19 04:47 PM EST
TOC
- 8.0a CHAT: Matching mechanism
- 8.0b ME: section 4.0 “the hackstack needle (HN)” algorithm.
- 8.1 What are ELINT and GEOINT?
- 8.2 How thousands of records become millions of candidate pairs
- 8.3 How we reduce the candidates to four results
- 8.3b one example of a calculation that yields a pair
- 8.3c drop duplicates
- 8.3d so the algorithm is simply (for 77,004,914 pairs) (THATS WHAT I WANTED)
- 8.3e why only 3 million (not 75 million) (silly question)
- 8.4 How Spark processes the data
- 8.5 The same pattern outside intelligence
8.0a CHAT: Matching mechanism
FDE: Next we should explain the matching mechanism before creating the pipeline:
what counts as a candidate spatial match, how the time-window filter narrows it, and which final checks produce the needles. We’ll inspect the original Correlate Intelligence (Pipeline Builder) as a reference—without changing it—so we reproduce its actual rules rather than guess.
ME: very good idea…. the target read knows (like me) basically nothing data science.
explain the core point where the needle search happens..
i believe its the attached pic.
and that this will use spark to do parallel processing on CPUs
(just like use CUDA to do on GPUs)…
if that is accurate.
FDE: Yes—the pictured filter is one of the key places where candidate matches are narrowed down
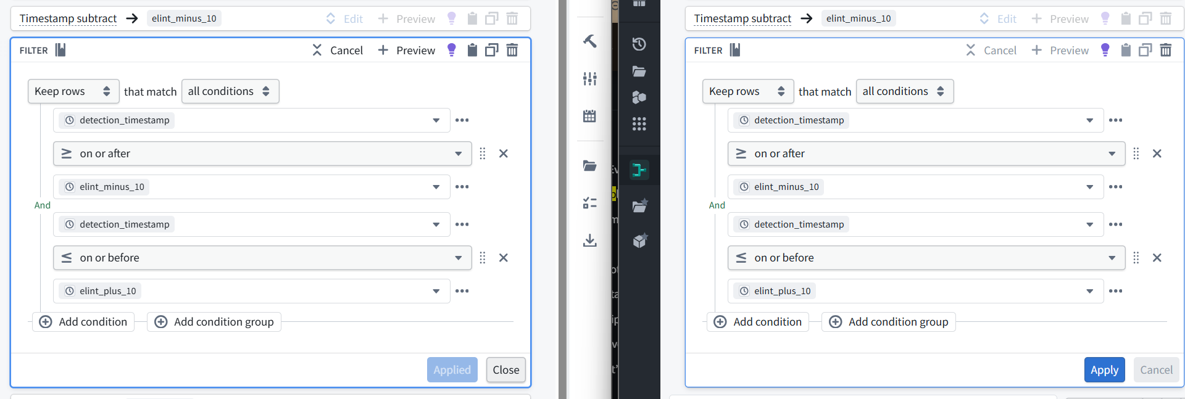
It applies a time-window test:
Keep a detection only if its timestamp falls between elint_minus_10 and elint_plus_10, including the boundaries.
We must inspect the preceding timestamp calculations to confirm the unit—the names alone do not tell us whether “10” means minutes, seconds, or something else.
Where the needle search happens
The search is the combined sequence of operations, not necessarily this filter alone:
1 Spatial matching: identify candidate pairs of observations in the same area.
2 Time filtering—the pictured step: retain pairs close enough in time.
3 Any further checks: narrow the candidates to the final results.
First find observations from approximately the same place. Then ask whether they happened at approximately the same time. Keep the pairs that satisfy both tests.
We’ll verify the original pipeline’s exact operations before presenting that as its full matching rule.
Does Spark parallelize this?
If this pipeline runs on Spark, yes:
Spark can evaluate the filter across data partitions in parallel on CPU workers. We should verify the pipeline’s execution configuration before labeling it specifically Spark.
Your CUDA comparison works at the broad conceptual level:
Express the operation once; let the execution system apply it across many records in parallel.
Spark distributes tasks across partitions and workers; CUDA executes kernels across GPU threads. They are different technologies, but parallelizing repetitive computation is the common idea.
The filter finds matches using explicit rules. No AI or data-science knowledge is required to understand this step.
ME: sounds good… thats enough… no reason to get into a lot of details…
reader wont undrestand until has done the demo.
so have a summary/review after its done.
Agreed. Before the build, just give the reader the purpose:
We’ll find observations that occurred near the same place and time, save the matches, and display them on a map.
Then build → preview → verify, explaining each setting when it is used.
Afterward, the summary will connect the steps: where matching happened, how each operation narrowed the candidates, and how the results reached the map.
8.0b ME: section 4.0 “the hackstack needle (HN)” algorithm.
the idea is to
(1)- explain ELINT and GEOINT data.

(2)- how we went from 3000 rows and 24000 rows in 4.4 and 4.5

(3)- to 4 rows in 4.8 (at the end)

(4)- also explain maybe spark... how these searches are done quickly

(5)- finally, this is sigint... but how HN algorithm can be used in other industries
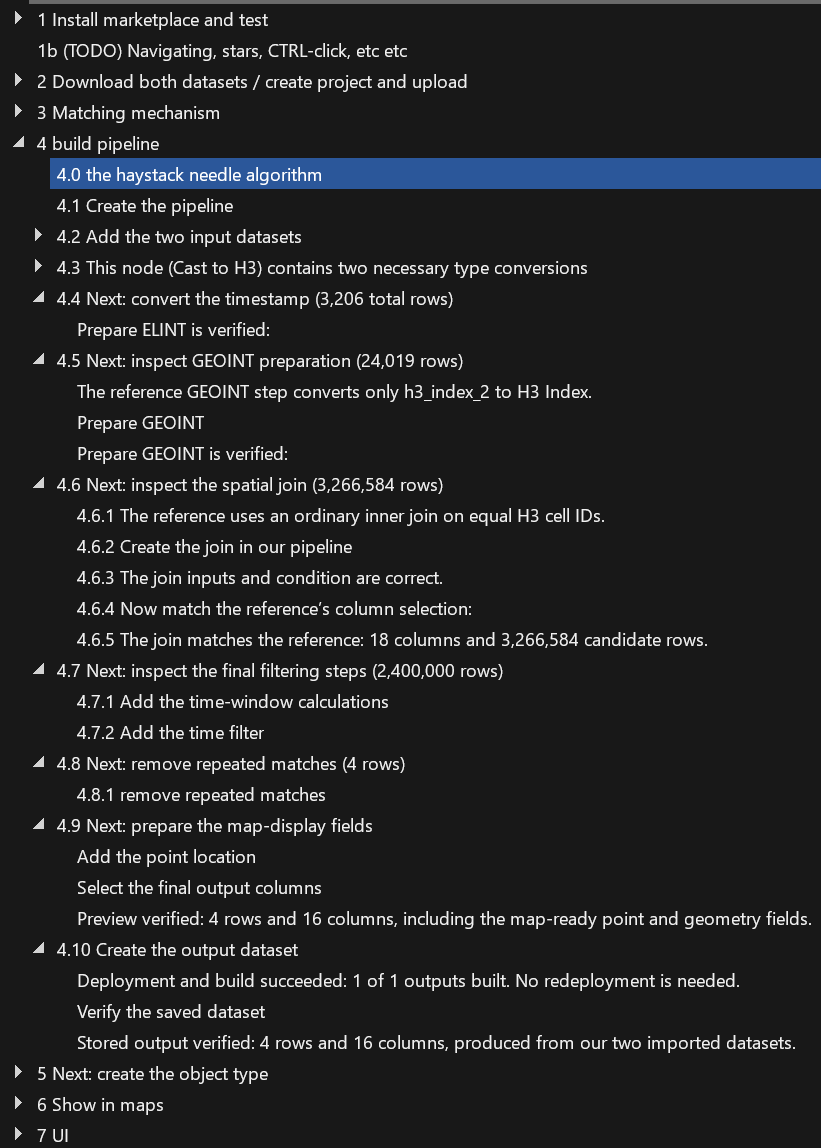
FDE: Our goal is to find observations that match in location and time, then display the results.
“Haystack–needle” is our teaching label for this workflow—not the name of a specific Foundry algorithm.
8.1 What are ELINT and GEOINT?
The example supplies two datasets:
-
ELINT—electronic intelligence: observations of electronic emissions, with timestamps, locations, track identifiers, and estimated location shapes.
-
GEOINT—geospatial intelligence: in this example, computer-vision detections with locations, detection timestamps, object labels such as ground_vehicle, and confidence values.
The question: which electronic observations have computer-vision detections in the same broad area and within a specified time window?
We use the supplied example data; we do not assume it represents real operational observations.
8.2 How thousands of records become millions of candidate pairs
Our inputs contain:
| Input dataset | Rows |
|---|---|
| ELINT Example | 3,206 |
| CV ATR GEOINT Example | 24,019 |
Each record includes an H3 cell ID. H3 divides the world into geographic cells; matching cell IDs identify observations in the same cell.
We join records with equal H3 IDs.
One ELINT record can match many GEOINT records, and vice versa. The join therefore produces 3,266,584 candidate pairs—more rows than either input.
These are possible matches, not yet four final needles. Sharing a coarse cell does not prove that two observations describe the same physical object.
FDE: The H3 cell ID is in the column named h3_index_2:
-
ELINT: second column from the right.
-
GEOINT: rightmost column.
Values such as 825b17fffffffff are H3 cell IDs. They are encoded identifiers, not latitude/longitude coordinates.
Both datasets already contain these IDs. Our Logical type cast → H3 Index tells Foundry how to interpret them; our join then matches records whose h3_index_2 values are equal.
FDE: Yes—the displayed GEOINT rows all have the same h3_index_2 value. We haven’t checked whether that is true for all 24,019 rows.
That is possible because H3 cells at resolution 2 cover large areas. Many detections at different coordinates can share one cell ID.
This explains why the join produces so many candidate pairs: it matches the same broad cell, not the same exact location.
We should clarify that in the tutorial—and verify the number of distinct H3 IDs before claiming they are all identical.
8229a7fffffffff

SELECT *

FROM `master`.`ri.foundry.main.dataset.9713551e-d12c-4e61-9b70-1db0873f9b65`

WHERE `h3_index_2` <> '8229a7fffffffff';
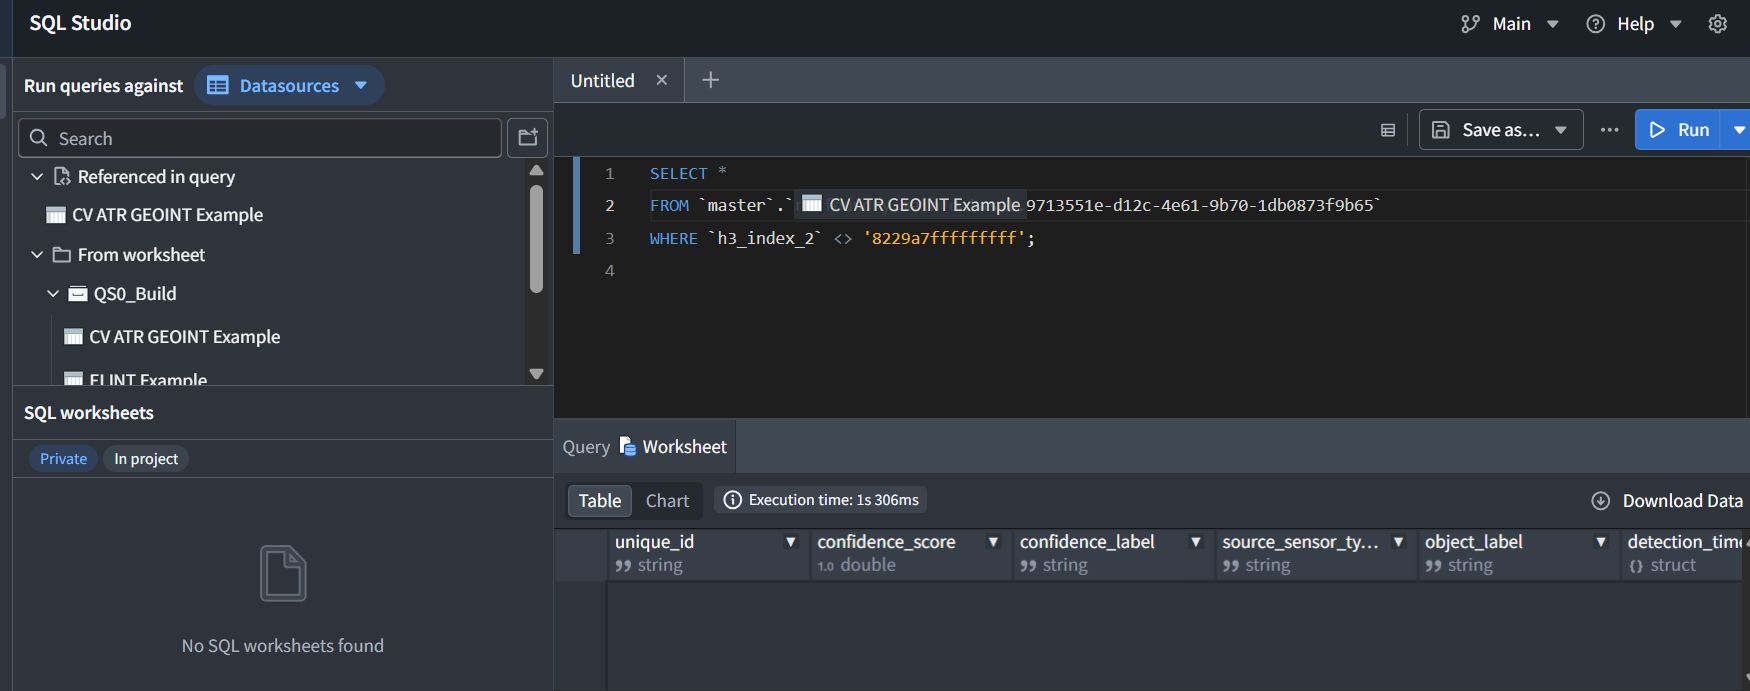
The query returned no rows: no non-null H3 ID differs from 8229a7fffffffff.
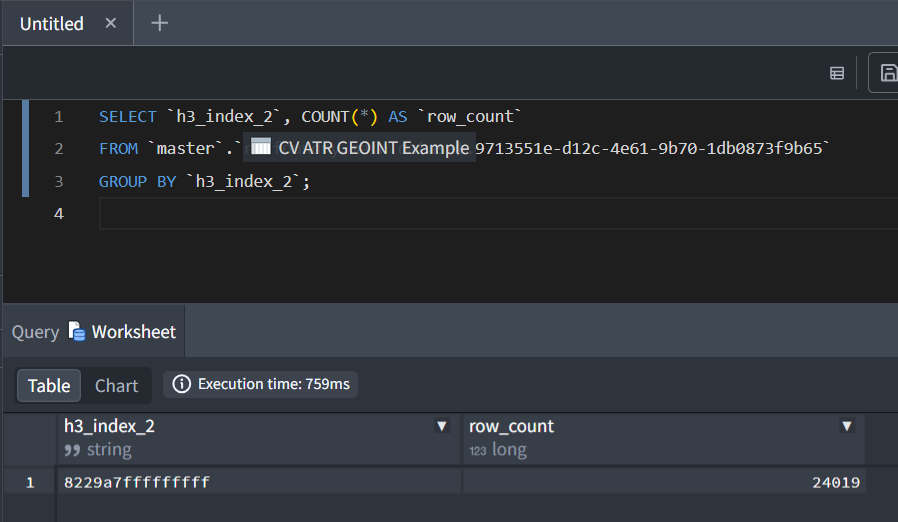
To check every value, including nulls, keep your existing FROM line and run:
SELECT `h3_index_2`, COUNT(*) AS `row_count`

FROM /* keep your existing dataset reference here */

GROUP BY `h3_index_2`;
If it returns one row with count 24,019, then every GEOINT record has that same H3 ID.
FDE: As a beginner tutorial, it has significant weaknesses—yes. What we’ve verified supports that criticism:
-
Misleading naming: elint_plus_10 actually adds one day.
-
Very coarse spatial matching: all GEOINT rows share one H3 cell, producing millions of candidate pairs.
-
Arbitrary result selection: dropping duplicates retains one detection without defining which is preferable.
-
Insufficient explanation: the distinction between candidate pairs and the four consolidated results is easy to miss.
A coarse H3 join is not inherently wrong—it can be a useful first-stage filter. But without a finer spatial test, we should not present these results as precise correlations or confirmed “needles.”
I would describe it as a geospatial tooling demonstration, not a rigorous detection algorithm. Your tutorial can make that limitation explicit while still using it to teach importing, joins, filters, Ontology, and maps.
8.3 How we reduce the candidates to four results
| Stage | Rule | Result |
|---|---|---|
| Match H3 cells | Pair observations with equal H3 cell IDs | 3,266,584 candidate pairs |
| Filter by time | Keep detections from 10 minutes before through 1 day after the ELINT timestamp | 2,419,560 pairs |
| Remove repeated matches | Keep one row per unique ELINT geometry + Track Id combination | 4 rows |
An important distinction: the time filter does not reduce millions of pairs directly to four. The final reduction comes from grouping repeated matches by the selected keys and retaining one representative.
The reference’s Drop duplicates operation keeps an arbitrary representative. Consequently, a retained detection’s timestamp or confidence may differ between runs. The four results are four unique key combinations with qualifying matches, not proof of four confirmed real-world targets.
8.3b one example of a calculation that yields a pair
Yes—take one ELINT observation and one GEOINT detection from our results.
ELINT H3 ID:   8229a7fffffffff

GEOINT H3 ID:  8229a7fffffffff
The join therefore creates a candidate pair containing both records.
2. Calculate the ELINT time window
The ELINT timestamp is:

June 27, 2024 at 08:16:14 UTC

Our calculations produce:

Lower boundary: June 27 at 08:06:14 UTC  (subtract 10 minutes)

Upper boundary: June 28 at 08:16:14 UTC  (add 1 day)
The paired GEOINT detection timestamp is:

June 27, 2024 at 17:30:47.524 UTC
| Filter condition | Result |
|---|---|
| Detection ≥ June 27 at 08:06:14 | True |
| Detection ≤ June 28 at 08:16:14 | True |
Both conditions pass, so the pair survives the time filter.
This establishes same coarse H3 cell + inside the configured time window—not necessarily the same physical object.
8.3c drop duplicates
we drop duplicates for For Column subset, select only:
-
elint_geometry
-
track_id
ME: i assume both of these values are in both datasets? can you give examples of these values, what they mean?
FDE: No—both columns come from the ELINT dataset. The join carries them into each candidate pair alongside the GEOINT fields.
| Column | Example | Meaning |
|---|---|---|
| track_id | d5973b87-ff5e-4d76-99f2-eccdfe1bd59e | Identifies an ELINT track. Multiple observations can belong to the same track. |
| elint_geometry | {“type”:”Polygon”,”coordinates”:[…]} | A GeoJSON polygon describing the ELINT observation’s geographic area. The … here abbreviates the actual coordinate list. |
What “drop duplicates” means here
It compares the combination of those two values:
(elint_geometry, track_id)
For example, suppose these joined rows survived the time filter:
| ELINT Track Id | ELINT geometry | Paired GEOINT detection |
|---|---|---|
| Track A | Polygon X | Detection 1 |
| Track A | Polygon X | Detection 2 |
| Track A | Polygon X | Detection 3 |
Drop duplicates keeps one arbitrary row, because all three share the same Track A + Polygon X combination.
It does not require their GEOINT detection IDs, timestamps, or confidence values to match.
So the four final rows mean:
Four distinct ELINT track-and-geometry combinations had at least one qualifying GEOINT match. We retain one representative pair for each combination.
ME: match = h3_index_2 in both are the same
Yes—the join’s “match” means only:
ELINT.h3_index_2 = GEOINT.h3_index_2
The time filter then checks whether that pair’s timestamps fall within the configured window.
Neither step compares elint_geometry with the GEOINT detection’s exact location.
8.3d so the algorithm is simply (for 77,004,914 pairs) (THATS WHAT I WANTED)
filter1:only entries with (ELINT h3_index_2 = ELINT h3_index_2).

filter2: only a single combination of ([ELINT trackid] ,  [ELINT Geometry])
Almost—you’re missing the time filter, and the first comparison is ELINT versus GEOINT.
The algorithm is:
(4.6) Join (=3,266,584): create pairs where ELINT.h3_index_2 = GEOINT.h3_index_2.
(4.7) Time filter (=2,419,560): keep pairs where the GEOINT detection occurred between 10 minutes before and 1 day after the ELINT timestamp.
(4.8) Deduplicate (=4): keep one arbitrary surviving pair per distinct combination of (ELINT.track_id, ELINT.elint_geometry).
Step 3 does not keep just one combination overall—it keeps one row for each combination, yielding four rows in this example.
Exactly 🙂 That three-step description is the core algorithm. The type conversions and map-field preparation support it; they are not additional matching rules.
8.3e why only 3 million (not 75 million) (silly question)
in 4.4 there are 3200, in 4.5 24,000 so why only ~3million spatial joins, not 75 million?
Because the join pairs only records with equal H3 IDs—not every ELINT record with every GEOINT record.
All 24,019 GEOINT records have H3 ID 8229a7fffffffff, but only 136 of the 3,206 ELINT records have that ID.
Therefore:
136 × 24,019 = 3,266,584 candidate pairs
Pairing every record with every record would instead produce:
3,206 × 24,019 = 77,004,914 pairs
The remaining 3,070 ELINT records have different H3 IDs, so they contribute no pairs to this inner join.
8.4 How Spark processes the data
We selected Standard batch compute, which is backed by Spark.
Rather than writing a loop that manually checks records one by one, we configure operations such as join, filter, and drop duplicates. Spark plans their execution and can distribute work across data partitions and available CPU workers.
Parallel processing helps with large collections, but speed also depends on data size, join structure, available compute, and startup overhead. Our small exercise demonstrates the mechanism—not a performance benchmark.
8.5 The same pattern outside intelligence
ELINT is part of signals intelligence; this example combines it with geospatial detections. But matching records by shared attributes, location, and time is broadly useful:
| Industry | Possible “needle” |
|---|---|
| Manufacturing | A defect associated with machine readings near its production time |
| Logistics | A delivery scan associated with a vehicle near the delivery location |
| Energy | An equipment alarm associated with nearby inspection observations |
| Retail | A stock discrepancy associated with relevant inventory movements |
The reusable pattern is:
Define a match → generate candidate pairs → apply additional conditions → consolidate results → inspect them.
We’ll now build each step. After completing the pipeline and map, return to this summary and connect each operation to the result you observed.